Evaluation Services - The Enterprise LLM Observability and Continuous Validation Plane
Introduction
Moving generative AI from an experimental Proof of Concept (PoC) into scaled production requires a structured, programmatic approach to measuring model performance. Unlike traditional software systems that yield deterministic outputs, probabilistic language models are susceptible to regression, semantic drift, and behavioral variance over time. Relying on manual human reviews or occasional spot checks is unsustainable for enterprise governance.
Evaluation Services establish the telemetry, observability, and validation fabric of the Enterprise AI Platform. Operating as a comprehensive hybrid plane, this service combines Real-Time Online Evaluation (monitoring live production streams for quality anomalies) with Offline Automated Regression Pipelines (verifying model performance within CI/CD pipelines before deployment).
By embedding continuous evaluation directly into the platform architecture, organizations can safely swap model endpoints, optimize costs, and enforce quality SLAs across all business workloads.
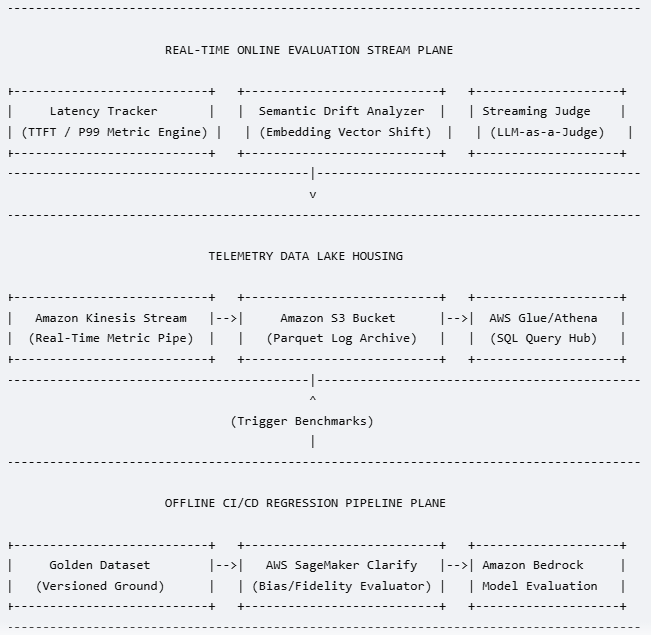
1. Real-Time Online Evaluation Topology
The online evaluation plane runs alongside the live production environment, intercepting request and response metrics to assess quality, performance, and behavior without blocking the user experience.
Real-Time Metric Engine and Latency Tracking
The evaluation service hooks directly into the Model Gateway to capture performance infrastructure metrics at the packet level:
- Time-to-First-Token (TTFT): Measures the duration between sending a prompt and receiving the first streaming token, capturing the real-world responsiveness of the model provider.
- Tokens-per-Second (TPS): Measures the generation velocity of the backend engine, helping identify capacity constraints or regional throttling.
- P99 Total Latency: Tracks moving latency averages to trigger automated routing switches if a model provider encounters performance degradation.
Streaming Semantic Drift Analysis
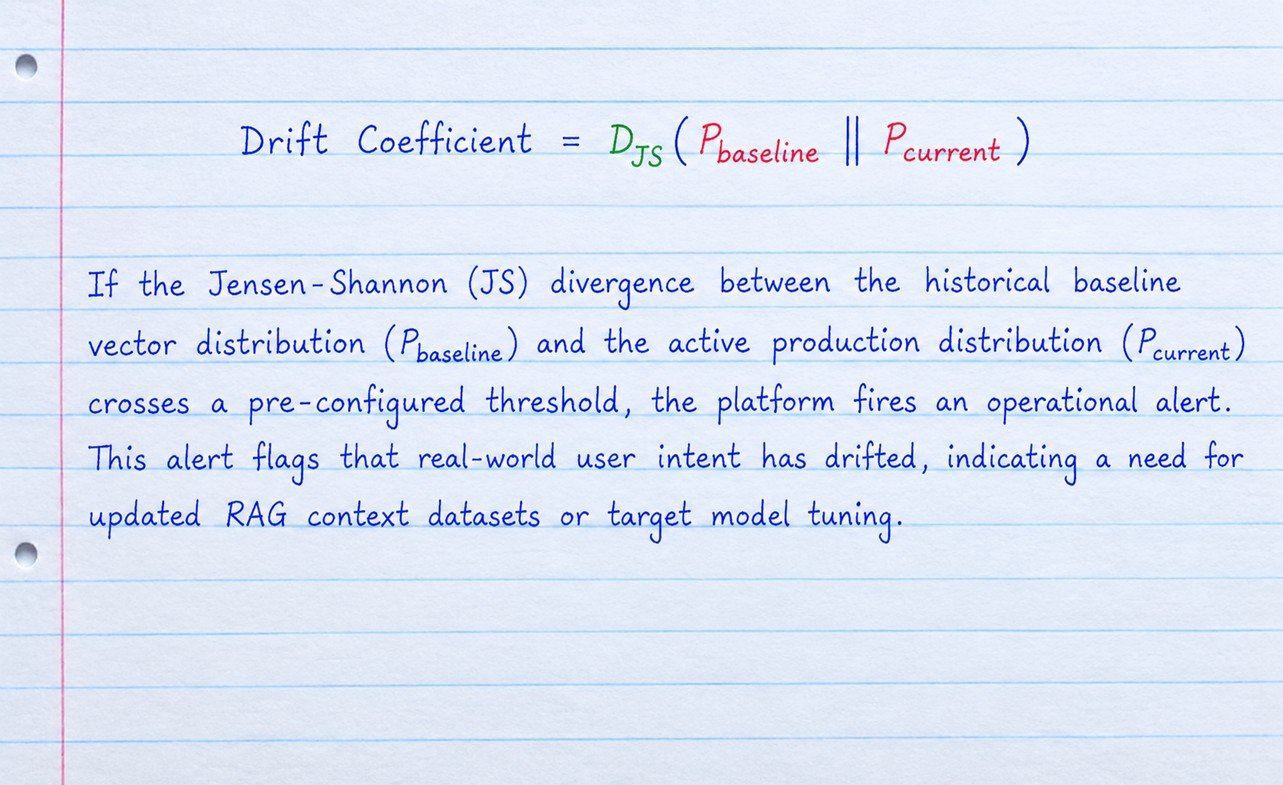
Over months of operation, user inputs and business data patterns naturally change. This shift can cause an index or model to perform poorly against new concepts, a problem known as Semantic Drift.
To catch this early, the evaluation plane systematically routes a percentage of incoming prompts through a lightweight embedding model. The resulting vectors are aggregated and evaluated using a sliding-scale distance function to track structural changes against historical baselines:
Streaming LLM-as-a-Judge Architectures
Evaluating qualitative metrics like tone, clarity, and brand compliance requires semantic analysis rather than simple pattern matching. The platform addresses this by routing a sample of production transactions to a background Streaming LLM-as-a-Judge worker group.
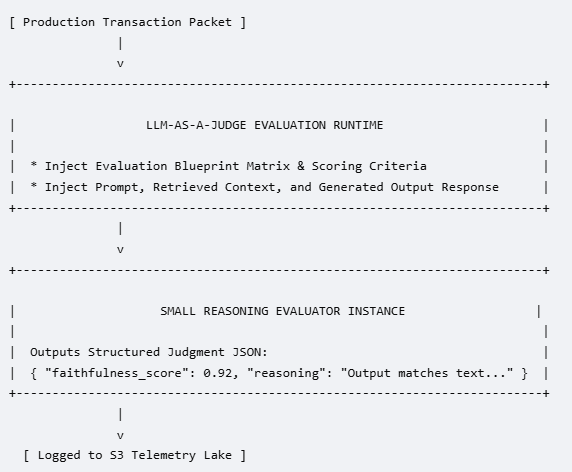
The system packages the original prompt, the retrieved context chunks, and the model's generated output into a structured evaluation prompt. A highly optimized, small reasoning model parses this bundle against an explicit scoring rubric, returning a structured JSON document with numerical evaluations and concise reasoning. This setup allows the platform to score abstract traits like completeness and brand voice at scale, completely out-of-band.
2. Offline Automated Regression Pipelines
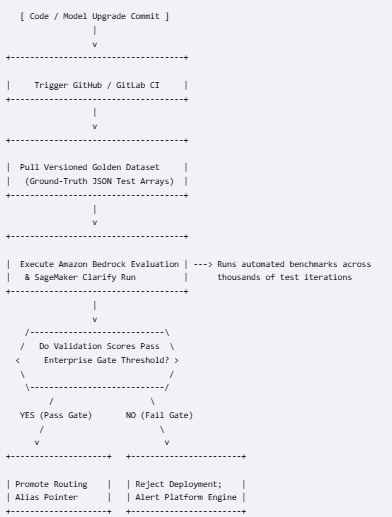
While online evaluation tracks the current production state, Offline Regression Pipelines act as the quality checkpoint within the platform's CI/CD workflow, verifying updates before they are deployed to users.
3. Enterprise-Grade Metrics Matrix In-Practice
To move past basic evaluation, enterprise platforms use a specialized metrics matrix to track performance, accuracy, and operational efficiency across the environment.
Contextual Metrics (RAG Alignment)
- Faithfulness / Groundedness: Measures whether the generated output relies only on the provided context or introduces outside assumptions. This metric is critical for catching hallucinations in legal or financial applications.
- Answer Relevance: Assesses how well the final response answers the user's core question, ensuring the system does not return generic or unhelpful text blocks.
- Context Recall: Evaluates whether the retrieval layer successfully pulled all the necessary source data required to address the prompt completely.
Qualitative and Brand Compliance Metrics
- Brand Voice and Alignment: Evaluates if the output matches the company's designated communication style, tone, and brand persona.
- Stereotype and Bias Mitigation: Uses automated toolsets like AWS SageMaker Clarify to scan responses for biased language, unintended stereotypes, or non-inclusive phrasing.
- Censorship and Escape Safety Elasticity: Verifies that the model follows system boundaries correctly, avoiding restricted topics while answering valid questions without over-refusal.
Operational and Sustainability Metrics
- Financial Efficiency Coefficient (FEC): Tracks the direct cost footprint of each transaction by balancing model performance against token expenditure:
FEC = Evaluated Accuracy Score / Total Generation Cost
- Carbon and Compute Footprint Monitoring: For self-hosted open-source clusters, this monitors actual GPU power usage per token generated, helping organizations track and report their AI infrastructure sustainability goals.
4. Reference Implementation: The Telemetry Data Lake
To manage evaluation metrics at scale without impacting user performance, the platform shifts heavy log processing to a decoupled, serverless telemetry data lake built with AWS primitives.
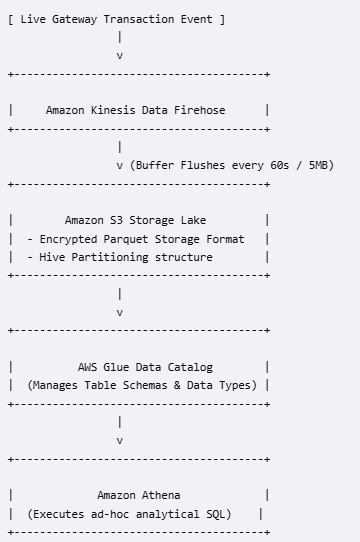
Telemetry Pipeline Mechanics
-
Buffered Ingestion: As transactions process, the Model Gateway drops comprehensive payload logs, including prompts, responses, tokens, latencies, and judge scores, directly into Amazon Kinesis Data Firehose. Firehose buffers this incoming stream, batching write requests every 60 seconds to optimize file sizes.
-
Partitioned Storage Sinks: Firehose flushes these logs directly into an Amazon S3 bucket, transforming the raw data into optimized, columnar Apache Parquet files. The data is organized into a clean Hive partition structure based on time and organization IDs, such as
year=2026/month=09/dept=finance/. -
Ad-Hoc Analytical Querying: An AWS Glue Data Catalog maintains the table schemas over the bucket. This setup allows platform engineers, data scientists, and risk officers to run standard SQL queries via Amazon Athena to analyze long-term performance trends across the platform:
-- Athena Query Example: Identifying Latency and Groundedness Drops across Models
SELECT
    model_id,
    AVG(cast(json_extract_scalar(evaluation, '$.faithfulness_score') as double)) as avg_groundedness,
    AVG(time_to_first_token_ms) as avg_ttft,
    COUNT(*) as total_requests
FROM "ai_platform_telemetry"."live_logs"
WHERE year = '2026' AND month = '09' AND department = 'operations'
GROUP BY model_id
ORDER BY avg_groundedness ASC;
5. Human-in-the-Loop (HITL) Feedback Loops: Continuous Alignment Pipelines
While automated evaluation layers provide consistent scaling, human expertise remains the definitive standard for assessing contextual nuance, brand alignment, and complex business logic. Relying purely on automated metrics can create an echo chamber where evaluation models fail to spot systemic errors that a human subject matter expert catches instantly.
A production-grade Enterprise AI Platform implements a Human-in-the-Loop (HITL) Feedback Loop. This architecture captures user explicit feedback, such as thumbs up/down, text edits, and ratings, and implicit signals, such as copying text or generating a revision, from frontend interfaces. It routes these metrics through a validation pipeline to clean, label, and automatically feed them back into the platform's golden datasets and fine-tuning pipelines.
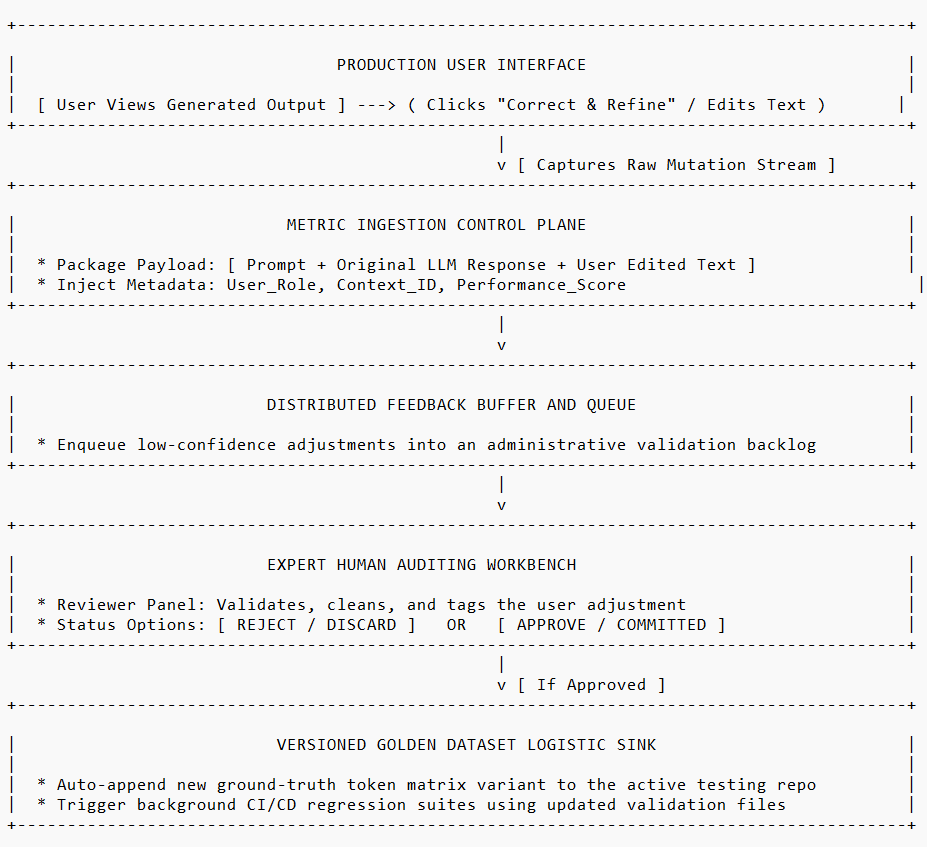
Capturing Multi-Signal Feedback at the Client Edge
Client applications connected to the platform capture two classes of user behavior, packaging them into structured feedback payloads:
- Explicit Signals: Binary votes, such as thumbs up or down, categorical error tags, such as
"hallucination","poor tone", and"incomplete response", and raw text edits where a domain expert manually rewrites a substandard model response. - Implicit Signals: Interaction telemetry, such as whether an agent-generated code snippet was successfully compiled or if a generated summary was copied directly into a document editor.
The Administrative Enrichment Pipeline
Raw user feedback can contain noise, spam, or conflicting modifications. To prevent this data from corrupting the system's test batteries, payloads are routed through a validation queue:
- Low-Confidence Filtering: Changes made by regular end users are tagged as low-confidence and processed through an automated filter. If a user flags a response as incorrect, the system verifies the claim by calculating the semantic distance between the user's rewrite and the original output.
- Expert Human Auditing Workbench: High-impact modifications, or text corrections submitted by authorized experts, such as senior legal counsels or compliance officers, are routed directly to an internal auditing dashboard. Reviewers can accept, edit, or discard these corrections, ensuring only high-quality data persists.
- Automatic Golden Dataset Injection: Once a correction is approved, the platform converts it into a standardized schema entry containing the initial prompt, the context fragments used, and the approved human text as the new ground truth. The entry is pushed directly to the platform's version-controlled testing repositories, updating the platform's evaluation benchmarks automatically.
6. SLA Breach Auto-Mitigation: Reactive Platform Self-Healing
Monitoring live telemetry is useless if the system cannot act on anomalies in real time. If a cloud-based model provider suffers a localized regional outage, encounters severe queue blockages, or begins producing low-quality, hallucinated responses due to an unannounced internal update, waiting for manual developer intervention leaves the enterprise exposed to immediate operational failure.
SLA Breach Auto-Mitigation turns the evaluation service into a reactive, self-healing control mechanism. Positioned directly alongside the inline monitoring pipeline, this logic evaluates every transaction block against strict Operational Service Level Agreements (SLAs). If performance drops or an anomaly is flagged, it changes platform routing tables dynamically to address the issue.
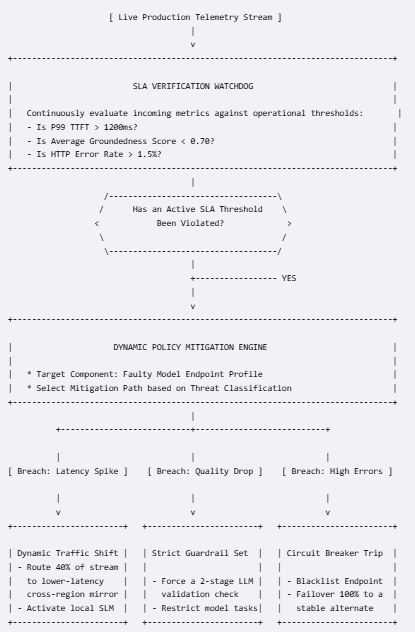
Threshold Classifications and Auto-Mitigation Trigger Vectors
The evaluation engine monitors and classifies platform anomalies into three core operational trigger paths:
- Path A: Infrastructure Latency Breaks: If the moving average of Time-to-First-Token (TTFT) for a primary frontier model exceeds a strict SLA target, such as
TTFT > 1200msover a 60-second window, the auto-mitigation coordinator modifies the Model Router's active weights. It dynamically splits traffic, shifting a portion of the workload to secondary cross-region inference profiles or activating faster, localized small language models (SLMs) to keep user interfaces responsive. - Path B: Qualitative Behavior Drops: If the Streaming Judge logs a sudden drop in factual accuracy or groundedness scores for a live RAG application, the system suspects model drift or data index issues. The platform tightens its guardrails immediately: it enables multi-stage context validation and routes incoming prompts through cross-checking models to catch and block hallucinations before they reach the user.
- Path C: Rate Limits and Failures: If a backend model provider returns an elevated rate of HTTP
429or5xxerrors, the system triggers a circuit breaker pattern. The platform blacklists the failing model endpoint for a defined cool-down window and re-routes 100% of production traffic to an independent fallback provider, keeping enterprise operations running without downtime.
7. Leadership Takeaways: Strategic Imperatives for the C-Suite
For technology executives, establishing an evaluation and observability plane is the defining step for moving generative AI from an unmanaged software component to an enterprise-grade utility asset.
To maintain transparency and operational control, technology leaders must focus on three core strategic imperatives:
- Make Telemetry Independent of the Inference Provider: Do not rely on your model vendor's internal dashboards to track performance and quality. The enterprise must operate its own independent telemetry data lake to gather unbiased metrics across all models, clouds, and private infrastructure.
- Enforce Quality Standards in the CI/CD Pipeline: Treat prompt changes and model updates exactly like traditional code updates. By locking deployment behind automated regression gates using curated golden datasets, you ensure that quality drops or regressions are caught and blocked before they can disrupt production users.
- Use Evaluation Metrics to Optimize FinOps Strategy: Tracking performance metrics alongside actual transaction costs allows you to measure your true financial efficiency. Use these continuous insights to identify areas where expensive frontier models can be safely replaced by smaller, highly optimized models, lowering costs without sacrificing operational quality.