Observability - Distributed Tracing and Core Operational Logging
Introduction
In traditional microservice architectures, observability focuses on monitoring structured transaction streams, HTTP status rates, and simple database query durations. However, within an Enterprise AI Platform executing compound chains and autonomous agent pipelines, traditional monitoring models break down. A single user prompt can trigger a highly complex, multi-layered Directed Acyclic Graph (DAG) consisting of query expansions, parallel vector searches, guardrail validations, multi-turn LLM calls, and recursive agent sub-tasks.
Without specialized observability, this non-linear execution model functions as a complete black box. When an application delivers an incorrect response or experiences a severe latency spike, identifying the exact root cause, whether it was a corrupted RAG context chunk, a slow cross-encoder reranker, an aggressive input guardrail, or a stalled agent sub-loop, is impossible.
The Observability Service provides the comprehensive tracing infrastructure required to make these non-linear workflows fully transparent. By combining advanced Distributed Tracing with structured Operational Logging, this plane captures execution context across every step of the lifecycle while tracking precise resource usage for enterprise billing attribution.
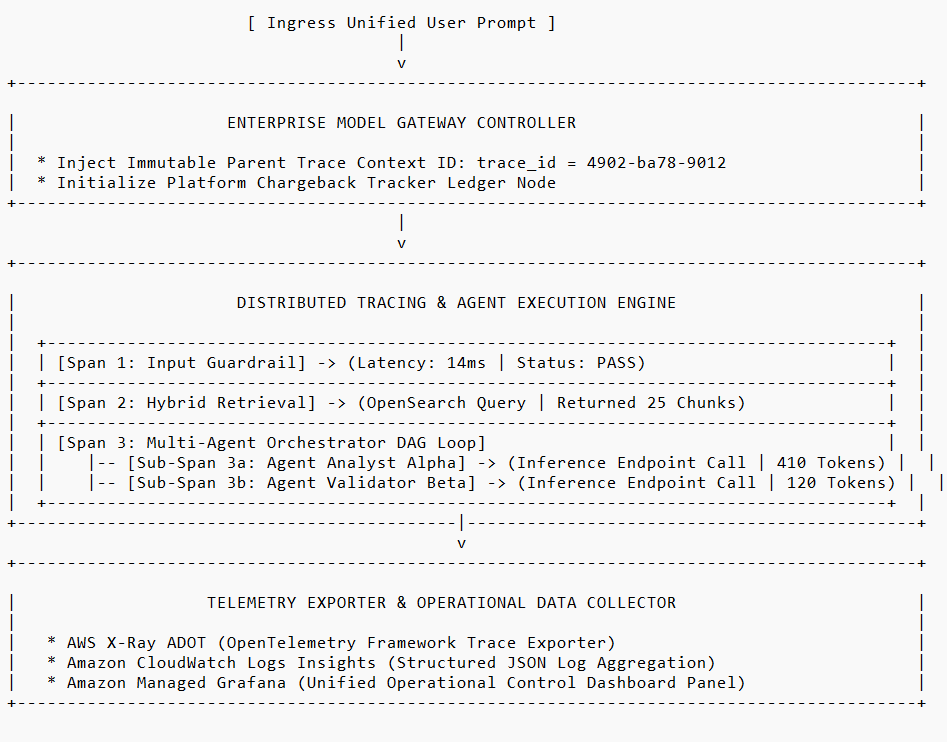
1. Distributed Tracing for Compound and Agentic Pipelines
To trace non-linear, multi-agent execution paths cleanly, the platform adopts the W3C Trace Context specification and implements a structured, hierarchically organized parent-child span framework using the OpenTelemetry (OTel) standard.
Trace Context Injection and Metadata Propagation
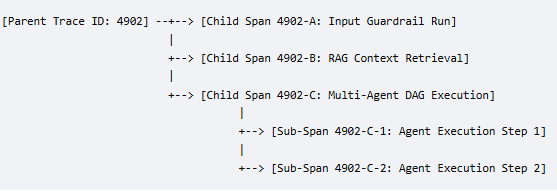
When a request enters the Model Gateway, the proxy generates an immutable Root Trace ID. This signature is injected into the transaction payload metadata and must be programmatically forwarded down the wire through every subsequent microservice, vector storage search, code execution block, and foundation model endpoint invocation.
Mapping the Execution DAG
Every distinct sub-operation in the lifecycle registers its actions by launching an isolated Child Span bound to the root identifier.
- Prompt-to-Retrieval Spans: The system logs the exact query transformation parameters, the time taken to run dense vector and sparse lexical searches, the raw text records returned by the vector database, and the final scoring compression metrics applied by cross-encoder rerankers.
- Model Call Spans: Every independent model execution tracks its specific operational parameters: target model name, temperature settings, raw input/output token payloads, and structural log-probability metrics.
- Multi-Agent Hierarchies: When an orchestrator model delegating work fires off multiple autonomous sub-agents in parallel, the platform dynamically generates a hierarchical tree structure. Each sub-agent functions as a nested execution span, allowing performance engineers to map the execution logic completely and isolate exactly which step triggered an error or performance bottleneck.
2. Stateful Session Tracing in Asynchronous Agent Loops
Unlike standard web calls that process synchronously and return responses within milliseconds, autonomous corporate agents frequently run long-form, multi-step execution loops. An analysis agent might spend hours running code in sandboxed test environments, querying APIs, analyzing intermediate datasets, and refining its logic across hundreds of asynchronous model invocations before compiling a final answer.
Traditional tracing frameworks drop tracking contexts when processes switch to background, asynchronous execution queues. The platform solves this limitation by using Stateful Session Tracing.
Maintaining Long-Lived Session Context
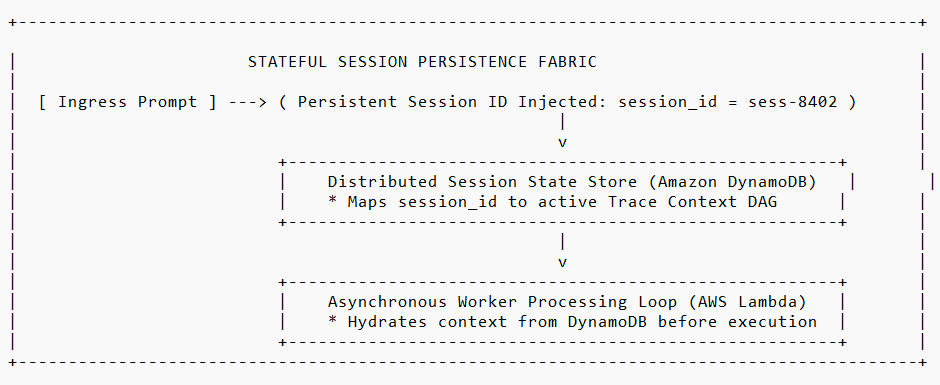
When a long-running, multi-step workflow begins, the platform binds the transaction to a persistent Session ID (session_id) alongside the active Trace ID. This session profile is stored in a distributed key-value database, such as Amazon DynamoDB, mapping the historical record of the execution graph across time boundaries.
Context Hydration and Dehydration Across Queues
- Dehydration: When an agent pauses execution to wait for an asynchronous job to finish or drops a task into a background processing queue, the orchestration engine saves the active OTel span state to the persistent database.
- Hydration: When a background worker picks up the task from the queue, it reads the session profile from the data store, hydrates the tracing context back into memory, and launches a new child span. This process ensures the long-running workflow is captured as a single, connected trace history, regardless of how many hours pass or how many distinct worker nodes process the code.
3. Token Consumption Attribution and Chargeback Ledgers
In a shared enterprise architecture, computing global AI platform costs is insufficient. Finance leaders require granular visibility to identify which specific departments, client applications, or business units are driving token expenditures.
The Observability Service includes a dedicated FinOps Chargeback Ledger Engine that processes log files to calculate exact operational resource allocation.
Granular Cost Allocation and Tagging
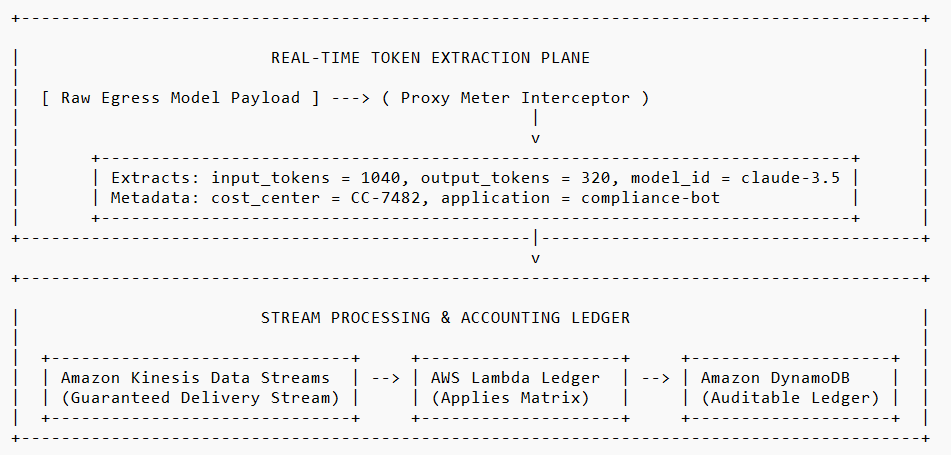
The platform gateway wraps every inference call in a structured envelope that maps corporate identity metadata down to the request level:
// Metered Execution Envelope Logs
{
  "trace_id": "4902-ba78-9012",
  "session_id": "sess-8402",
  "timestamp": 1792184100,
  "attribution": {
    "cost_center": "CC-7482",
    "department": "Global-Risk-Management",
    "application_id": "compliance-audit-bot"
  },
  "usage": {
    "model_provider": "aws-bedrock",
    "model_string": "anthropic.claude-3-5-sonnet-v1:0",
    "prompt_tokens": 1040,
    "completion_tokens": 320
  }
}
The Immutable Accounting Ledger Pipeline
To guarantee that chargeback data is audit-ready and free from loss, processing runs through a guaranteed-delivery pipeline:
- Ingress Stream Capture: The gateway drops the usage packet directly into Amazon Kinesis Data Streams, using the
cost_centeras the partition key to ensure orderly record management. - Pricing Matrix Application: An AWS Lambda function processes the batch logs. It reads the model provider information, looks up the current contract pricing matrix for that specific day and region, and calculates the exact transaction cost.
- Audit Ledger Persistence: The calculated transaction is written into an immutable Amazon DynamoDB Ledger Table. This clean data sink serves as the single source of truth for monthly corporate financial reconciliations and FinOps dashboards, enabling transparent internal billing chargebacks across the entire organization.
4. Operational Infrastructure Logging and Enterprise Controls
Beyond tracking costs and traces, the platform must manage low-level logging hygiene, ensuring data compliance and system reliability across all integrated environments.
Cross-Tenant Log Isolation and Redaction
In a multi-tenant enterprise system, logs must be secured as strictly as production storage.
- PII and Secret Stripping: Before log files are flushed to disk, an automated redaction proxy scrubs raw prompts and responses. This step removes API keys, passwords, and sensitive PII tokens, preventing data leaks within monitoring systems.
- Cryptographic Tenant Isolation: Every log entry is stamped with its validated tenant ID. Security access configurations inside Amazon CloudWatch enforce strict segment boundaries, ensuring that operations teams can query logs only for departments they are explicitly authorized to manage.
Standardized AI Platform Error Mappings
To help developer teams troubleshoot failures quickly across disparate cloud APIs and internal self-hosted open-source clusters, the Observability Service maps varied vendor error codes to a single, standardized corporate framework:
| Ingress Provider Error Code | Platform Normalized Error Code | Structural Architectural Meaning | Auto-Mitigation Action |
|---|---|---|---|
OpenAI 429 / Bedrock ThrottlingException | AI_PLATFORM_PROVIDER_THROTTLED | Downstream model rate limits hit (RPM/TPM constraints saturated). | Switch to alternate regional endpoint or fallback model tier. |
Azure ContextWindowExceeded | AI_PLATFORM_CONTEXT_MAX_BOUND | Combined prompt and history tokens exceed model capacity. | Trigger structural truncation or history summarization filters. |
Anthropic 503 / OpenAI InternalServerError | AI_PLATFORM_PROVIDER_UNAVAILABLE | Downstream model cluster or cloud availability zone is experiencing an outage. | Trip the circuit breaker and route traffic instantly to a fallback cloud vendor. |
5. Architectural Implementation Blueprint: The AWS OpenTelemetry Stack
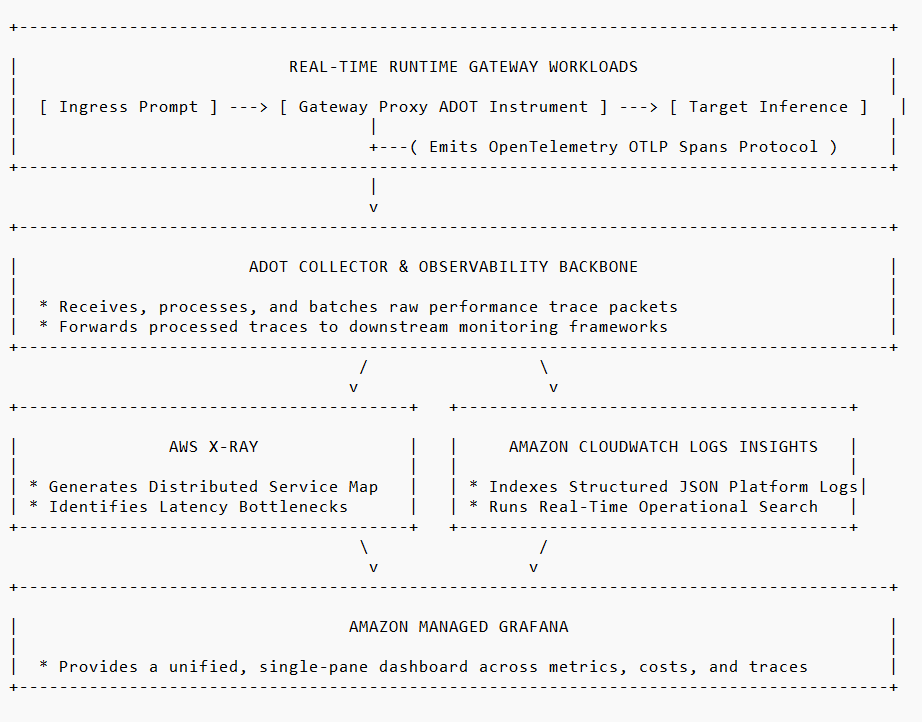
The practical deployment of the Observability Service maps directly onto AWS Native Serverless Telemetry Frameworks, using the standard AWS Distro for OpenTelemetry (ADOT).
Telemetry Backbone Mechanics
- ADOT Instrumentation: The Model Gateway and agent containers are instrumented using the AWS Distro for OpenTelemetry (ADOT) collector agent. This agent gathers trace spans and exports them using the standard OpenTelemetry Protocol (OTLP).
- Trace Map Generation: The ADOT collector sends execution traces directly to AWS X-Ray, which parses the span links to compile a live Service Map. This map lets engineers spot downstream latency lags across systems instantly.
- Unified Visual Dashboards: Structured system logs flow into Amazon CloudWatch Logs Insights for indexing. Amazon Managed Grafana connects to both CloudWatch and AWS X-Ray, giving operations and finance leaders a single pane of glass to monitor platform health, performance traces, and FinOps costs in real time.
6. Leadership Takeaways: Strategic Imperatives for the C-Suite
For technology executives, observability in a generative AI ecosystem is a structural necessity for operational governance, data compliance, and fiscal discipline.
To maintain transparency and system stability, technology leaders must focus on three core strategic mandates:
- Enforce End-to-End Tracing Across Every Agentic Step: Do not let your platform function as an unmonitored black box. Insist on a standardized, OpenTelemetry-compliant distributed tracing system that maps every step of your multi-agent execution graphs, ensuring developers can quickly isolate and fix quality and latency drops.
- Tie Every Inference Call to an Audit-Ready Cost Center: Treat token consumption with the same accounting rigor as traditional cloud infrastructure spend. By implementing automated token tracking ledgers at the gateway wire level, you enable accurate, data-backed internal billing chargebacks and prevent surprise vendor invoices.
- Build Your Observability Stack on Vendor-Neutral Standards: Guard your architecture against tool and platform lock-in. By using open instrumentation frameworks like OpenTelemetry to collect and export metrics, you preserve the long-term flexibility to switch backend storage, monitoring platforms, and cloud vendors without rebuilding your application instrumentation.