Product KPIs vs. model KPIs
Enterprise success with Artificial Intelligence requires a strict separation and a deliberate mapping between technical model metrics and business product metrics.
Engineering and data science teams often focus exclusively on optimization within isolation. Conversely, business stakeholders and executives care only about systemic, bottom-line impact. When these two worlds fail to communicate, AI initiatives stall, budgets are wasted, and technically brilliant models are decommissioned because they fail to move the business needle.
To build sustainable, high-ROI AI capabilities, technology leaders must bridge this gap. This blueprint defines both dimensions, analyzes their operational friction, and provides a framework to align mathematical performance with enterprise value.
1. The Core Duality
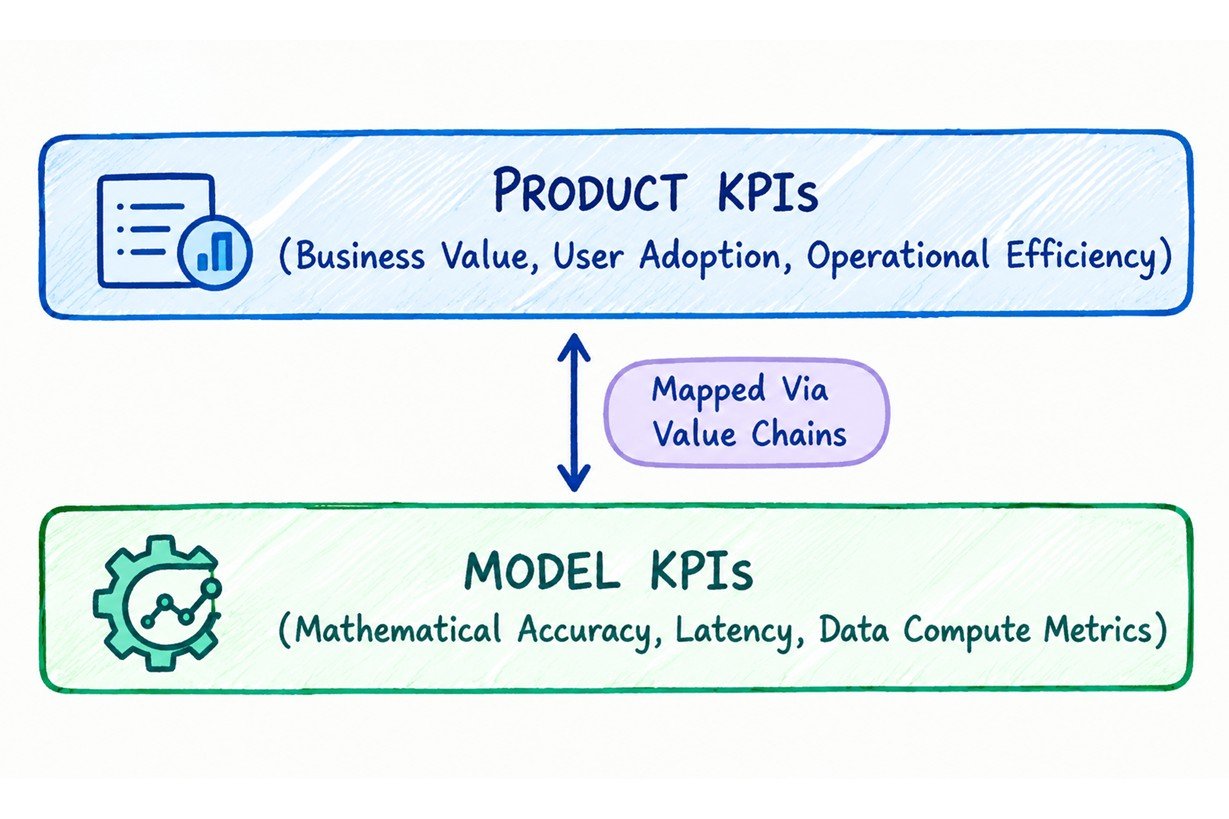
Model KPIs: Mathematical & Systems Performance
Model KPIs measure the intrinsic capabilities, statistical correctness, and computational efficiency of the underlying Machine Learning (ML) or Large Language Model (LLM) architecture. They are isolated, objective metrics quantified in data environments.
- What they answer: Is the algorithm functioning correctly according to its training parameters?
Product KPIs: Business & User Impact
Product KPIs measure the macro-level impact of the software application on the business ecosystem, its operational workflows, and its human end-users. They are holistic metrics quantified in production environments.
- What they answer: Is the application solving the user's problem and generating measurable economic value?
2. Deep Dive: Model KPIs vs. Product KPIs
To manage both sides of the equation effectively, leaders must understand what each layer tracks and why high performance in one does not automatically guarantee success in the other.
| Dimension | Model KPIs (Technical Layer) | Product KPIs (Business Layer) |
|---|---|---|
| Primary Focus | Algorithmic precision and system efficiency. | User behavior, workflow optimization, and financial returns. |
| Key Stakeholders | Data Scientists, ML Engineers, MLOps, Infrastructure Teams. | Product Managers, CTOs, CFOs, VPs of Operations, End Users. |
| Typical Metrics | Latency, Perplexity, F1 Score, BLEU/ROUGE, Recall@K. | Task Completion Rate, Time to Value, Cost per Transaction, ROI. |
| Failure Mode | "The model works perfectly in the sandbox, but nobody uses it." | "Users love the concept, but the system costs too much to run." |
Essential Model KPIs to Track
- Token Latency (TTFT & ITL): Time-to-First-Token (TTFT) measures responsiveness, while Inter-Token Latency (ITL) dictates the reading pace. Essential for optimizing real-time user experiences.
- Perplexity & Cross-Entropy Loss: Measures how well a model predicts a sample. Lower perplexity indicates a model that is more confident and structured in its outputs.
- Retrieval Metrics (MRR, NDCG, Precision@K): In Retrieval-Augmented Generation (RAG) systems, these quantify how accurately the system fetches relevant context from an enterprise knowledge base.
- F1-Score / Precision / Recall: The standard triad for classification tasks, balancing the cost of false positives against false negatives.
Essential Product KPIs to Track
- Task Completion Time (TCT): The total time a human user spends interacting with a workflow to achieve a successful outcome.
- User Adoption & Retention Rates: The percentage of the target workforce or customer base that actively integrates the AI tool into their daily routines over 30, 60, and 90 days.
- Error Reduction Rate: The drop in costly operational mistakes (e.g., billing errors, compliance breaches, shipping miscalculations) after implementing the AI assistant.
- Total Cost of Ownership (TCO) & Unit Economics: The total cost to serve a single user request (API costs + compute infrastructure + maintenance) versus the value or savings generated by that request.
3. The Dangerous Disconnect: High Model Accuracy ≠ Business Value
A common trap for enterprise AI projects is the "Optimization Paradox." A model can achieve near perfect mathematical scores while failing to solve the target business problem.
Scenario A: The Flawless RAG System That Users Abandon
An engineering team builds a customer support RAG system. The model achieves an outstanding 95% Precision@3 score during evaluation.
However, because the document chunking strategies are overly massive, the model takes 8.5 seconds to return an answer to the customer support agent. Because the agent is measured on a product KPI of Average Handle Time (AHT), they bypass the AI entirely and manually look up the answer in a legacy wiki because it only takes them 5 seconds.
The model is a technical triumph but a product failure.
Scenario B: The Over Optimized Classifier
A fraud detection model is tuned to reach a 99.2% Recall score to catch every possible fraudulent transaction.
In production, this hyper sensitivity triggers an overwhelming volume of false positives. The company's compliance operations team is flooded, causing the product KPI of False Positive Resolution Time to skyrocket.
Legitimate customer accounts are frozen, driving down the ultimate product KPI: Customer Lifetime Value (LTV).
4. The Unified Framework: Mapping Model Performance to Product Value
To build a high-performing AI organization, architecture and product leaders must create an explicit Value Chain Matrix. Every technical optimization must directly justify its impact on a business metric.
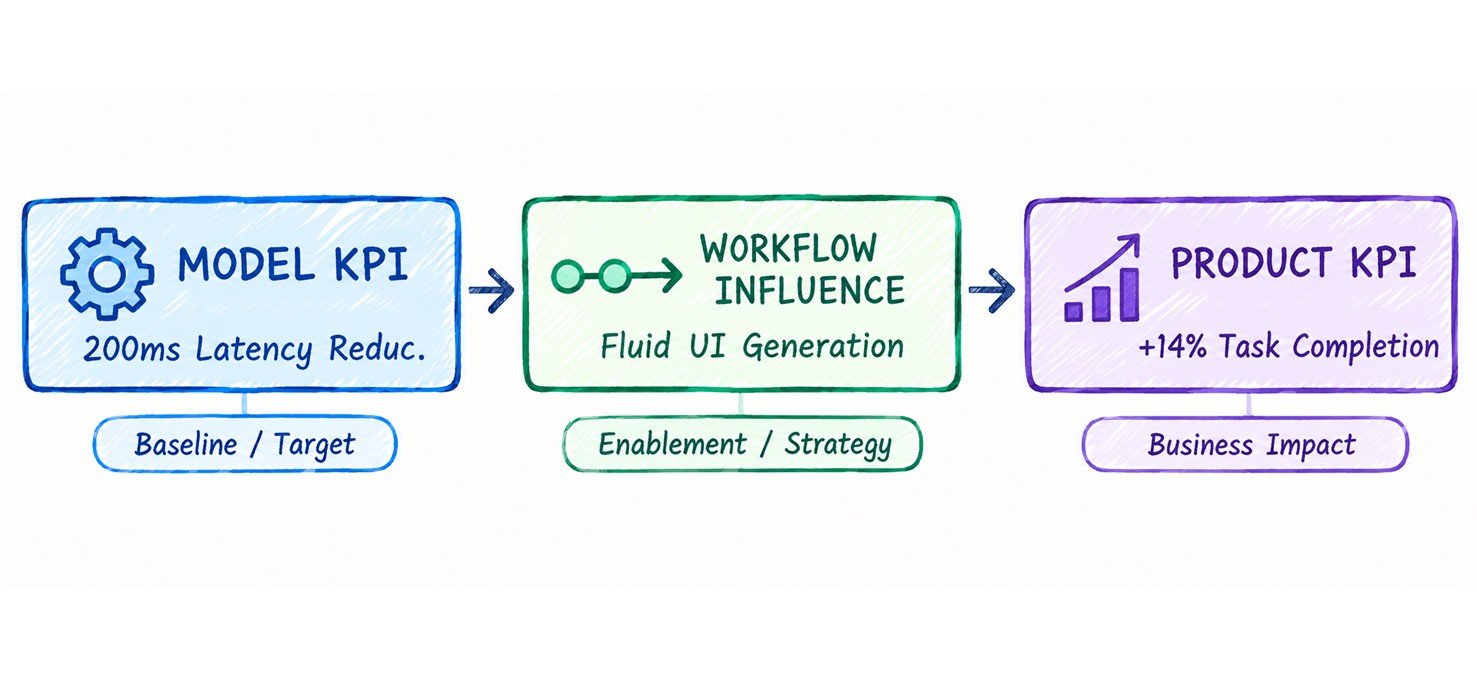
Strategic Mapping Examples
Example 1: Customer Self-Service Bot
- Technical Initiative: Improve Context Retrieval Precision via hybrid keyword/semantic search.
- Model KPI: Increase NDCG@5 from 0.72 to 0.88.
- Product KPI Translation: Reduces hallucination rates and delivers exact answers faster. This drives down the enterprise product KPI of Customer Support Deflection Rate (fewer tickets escalated to humans), directly lowering Operational Cost per Customer.
Example 2: Financial Analyst Co-Pilot
- Technical Initiative: Implement speculative decoding and quantization to optimize throughput.
- Model KPI: Reduce Time-to-First-Token (TTFT) from 1,200ms to 300ms.
- Product KPI Translation: Eradicates the user-perceived lag in the interface. This shifts the product KPI of Daily Active User / Monthly Active User (DAU/MAU) Ratio upward by 25%, indicating the tool has shifted from an annoyance to an indispensable asset.
Example 3: Medical Billing Automation
- Technical Initiative: Fine-tune a smaller open-source model on proprietary medical coding taxonomy.
- Model KPI: Shift the F1-Score from 0.81 to 0.94.
- Product KPI Translation: Fewer claims are rejected by insurance companies due to incorrect coding. The business realizes a direct reduction in Days Sales Outstanding (DSO) and increases Net Revenue Realization.
5. Architectural & Governance Action Plan for Leaders
For CTOs, VPs, and Enterprise Architects, operationalizing this distinction requires structural changes in how teams are organized, platforms are architected, and success is reviewed.
1. Form Cross-Functional Product Triads
Never let data scientists build models in isolation. Every AI initiative should be governed by a triad consisting of:
- ML Engineer: Owner of Model KPIs
- Product Manager: Owner of Product KPIs
- Domain Expert / End User: Validator of contextual utility
2. Design Observability Pipelines for Both Tiers
Your MLOps architecture must capture metrics at both layers simultaneously.
-
Model Gateway Layer
Examples: Langfuse, Arize, Weights & Biases
Track prompt costs, latency, semantic drift, and embedding distances. -
Application Analytics Layer
Examples: Mixpanel, Datadog
Track user click through rates, thumbs up / thumbs down feedback, feature adoption, and task abandonment. -
The Nexus
Correlate both layers. For example, run queries to determine whether sessions with higher model latency directly correspond to higher user drop off rates.
3. Implement Guardrails and Dynamic Routing
Enterprise Architects should build intelligent middleware that balances these metrics dynamically.
If a model's latency spikes beyond an acceptable threshold, violating a Product KPI constraint, the system should automatically route traffic to a faster, lighter fallback model or a cached response bank to preserve the user experience.
4. Establish Value Driven Gatekeeping in CI/CD
Before any updated model is promoted from staging to production, it must pass a dual gate:
- Model KPI Gate: Did it maintain or improve its benchmark Model KPIs, such as accuracy or loss?
- Product KPI Gate: Did it pass simulated or shadow testing benchmarks for Product KPIs, such as inference cost ceilings and user facing latency budgets?
By enforcing this structural alignment, technology executives transform AI from an expensive experimental playground into a predictable, highly scalable engine of enterprise growth.