Defining measurable success criteria
Designing a High-Performance AI Measurement Framework
To successfully scale enterprise AI, technical leaders must establish quantitative baselines and target benchmarks across three critical dimensions: user utility, operational efficiency, and financial viability. Moving an AI product from a successful proof-of-concept (PoC) to a production-grade asset requires shifting from qualitative "vibe checks" to rigid, real-time observability. Without clear thresholds, systems face silent failures, compounding token deficits, and drifting user alignment that erode business value.
1. The Three-Dimensional AI Success Matrix
Enterprise AI systems cannot be evaluated by traditional software metrics alone. Leaders must monitor a triad of intersecting dimensions to ensure comprehensive system health.
1. The Three-Dimensional AI Success Matrix
Enterprise AI systems cannot be evaluated by traditional software metrics alone. Leaders must monitor a triad of intersecting dimensions to ensure comprehensive system health.
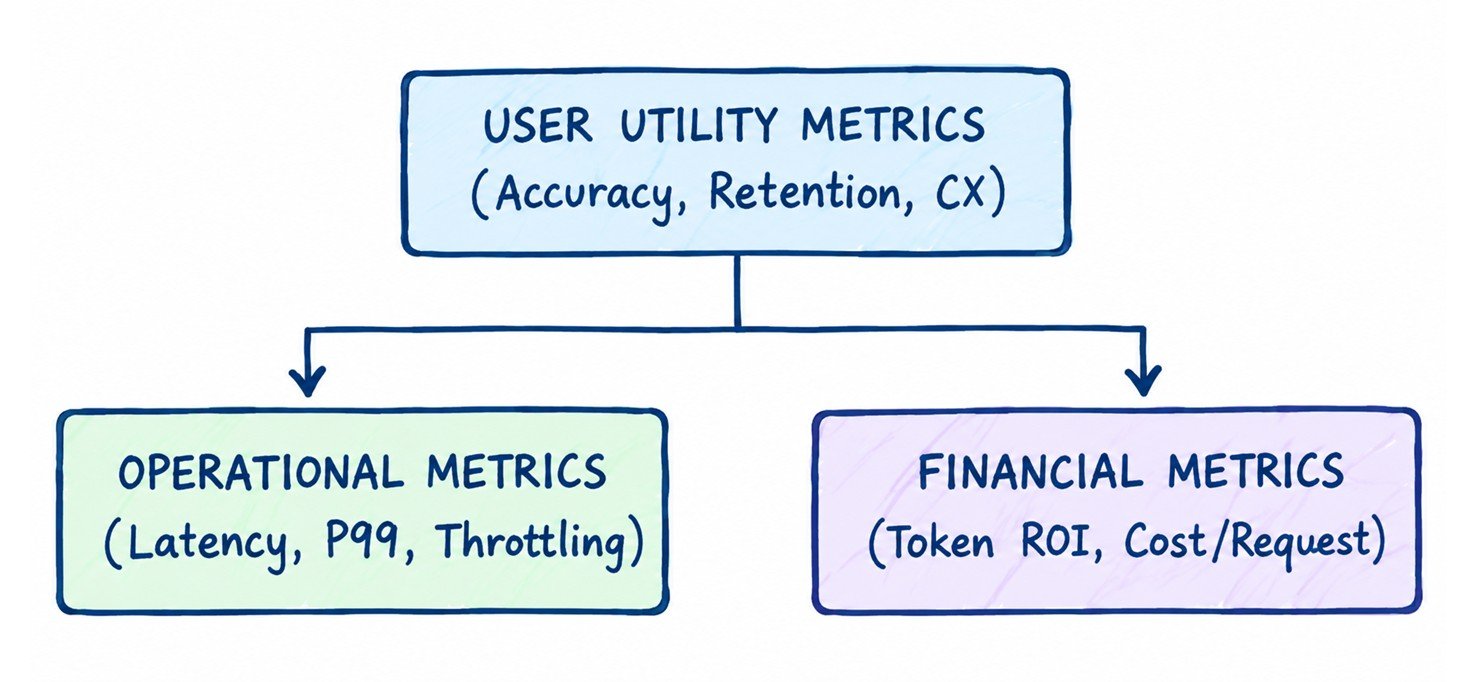
Dimension A: User Utility Metrics
User utility measures whether the system effectively solves the core user problem. For Large Language Models (LLMs) and generative systems, this requires evaluating both deterministic outputs and subjective human alignment.
-
Task Alignment & Task Completion Rate (TCR): The percentage of interactions where the AI successfully fulfills the user’s intent without requiring escalation or manual overrides.
-
Response Factuality & Hallucination Rates: Quantified via automated evaluation frameworks (e.g., RAGAS, TruLens) using metrics like Faithfulness (is the answer derived strictly from context?) and Answer Relevance (does it directly address the prompt?).
-
User Correction & Edit Distance: In copilot or text-generation scenarios, track how much of the AI-generated output the user modifies before saving. A high Levenshtein edit distance indicates low utility.
-
Explicit & Implicit Feedback Loops: Explicit metrics track thumbs-up/down ratios (target >85% positive). Implicit metrics track downstream actions, such as copy-to-clipboard rates, immediate session termination (success), or rapid re-prompting (failure).
Dimension B: Operational Efficiency Metrics
Operational metrics ensure the infrastructure can sustain production loads under strict Service Level Agreements (SLAs).
| Metric Category | Target Production Benchmark | Operational Significance |
|---|---|---|
| Time to First Token (TTFT) | < 800 ms (Streaming) | Critical for perceived user responsiveness and conversational fluidness. |
| Tokens per Second (TPS) | > 30 tokens/sec per user | Dictates how quickly large payloads or summaries are delivered to the UI. |
| P99 Latency | < 4.0 seconds (Total roundtrip) | Caps the worst-case wait times for enterprise end-users. |
| Context Window Saturation | 60% - 80% optimal capacity | Prevents accuracy degradation (needle-in-a-haystack issues) and out-of-memory errors. |
| API Error & Throttling Rate | < 0.1% | Tracks rate limits (TPM/RPM structural constraints) and fallback success. |
Dimension C: Financial Viability Metrics
Financial metrics tie technical performance directly to corporate profitability, ensuring the system does not burn more capital than it recovers.
-
Cost per Inference/Transaction: The fully loaded cost of a single execution, calculated as:
Cost = (Input Tokens x Input Rate) + (Output Tokens x Output Rate) + Vector DB Lookup Costs + Hosting Overhead ]
-
Token Efficiency Ratio: The volume of revenue or cost savings generated divided by the millions of tokens consumed.
-
Cache Hit Rate (Semantic & Exact): The percentage of queries resolved via an intermediate semantic cache (e.g., GPTCache, Redis Cloud) rather than hitting the raw LLM provider. Target a >= 30% cache hit rate to slash variable API bills.
2. Implementing Real-Time Observability and Alerting
Leaders cannot manage what they do not see. Enterprise architectures must incorporate a dedicated LLM observability layer (e.g., Arize, Langfuse, Weights & Biases, Datadog LLM Observability) directly into the runtime pipeline.
Dashboard Architecture Requirements
-
Dual-Tracer Pipeline: Capture asynchronous spans for every step of an execution path:
Prompt Template → Guardrails → Semantic Cache → Vector Search → LLM Call → Post-Processing Guardrails -
Telemetry Payload: Every logged transaction must append standard metadata: Model ID, Temperature, System Prompt Version, Input/Output Token Counts, Latency Breakdown, User ID, and Tenant ID.
Automated Alerting Strategy
Set up multi-tiered alerting via webhooks into PagerDuty, Slack, or ServiceNow based on rigid operational and financial thresholds:
-
Severity 1 (Critical - Immediate Paging):
- Success rate drops below 95% over a 5-minute rolling window.
- Financial spend exceeds 150% of the daily amortized budget run rate (indicating an infinite loop, prompt injection attack, or a rogue script).
-
Severity 2 (Warning - Ticket Generated):
- P99 latency increases by >25% over a 1-hour baseline.
- Semantic drift detected in user queries, indicating the production workload no longer matches validation datasets.
3. The Ultimate Strategic Threshold: Token Economics vs. Human Labor
The foundational rule of enterprise AI architecture is economic substitution. If the cost of running an automated system exceeds the cost of equivalent human labor, the technical architecture is fundamentally flawed.
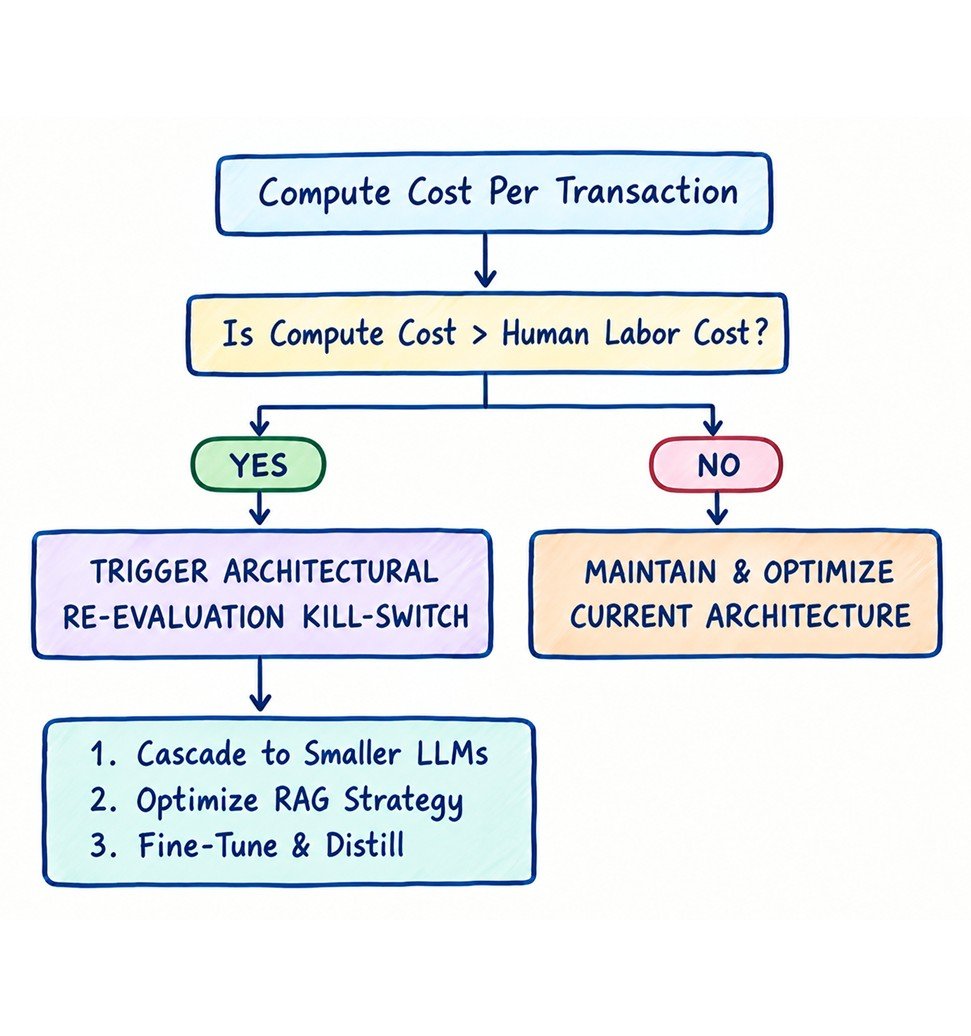
The Architectural Kill-Switch Formula
Evaluate system viability using the following economic constraint:
Fully Loaded Token Cost per Task + Amortized Infrastructure Overhead < Hourly Human Wage x Hours Spent per Task
If the left side of the equation equals or exceeds the right, architects must systematically execute down-scaling strategies:
-
Model Cascading:
Route simpler, deterministic queries to hyper-optimized, low-cost frontier models or open-source edge models (e.g., routing from GPT-4o to GPT-4o-mini or Llama-3-8B) based on an intent classifier. -
RAG Document Pruning:
Tighten vector database retrievaltop-Kcutoffs and implement aggressive reranking to minimize context token bloating. -
Knowledge Distillation:
Transition from expensive zero-shot prompting on massive commercial models to a fine-tuned, smaller, open-source model trained explicitly on your collected high-quality production logs.