Model Performance Monitoring and Statistical Drift
Introduction
In classical software systems, once validation tests pass and code is deployed to production, its logical behavior remains static. Performance monitoring focuses primarily on infrastructure availability, CPU utilization, and input-output data validation boundaries.
However, generative AI systems introduce silent degradation. Even when infrastructure maintains perfect uptime and upstream model APIs return successful HTTP 200 responses, runtime accuracy can deteriorate due to evolving user input distributions, updates to foundational model checkpoints, or outdated vector retrieval data.
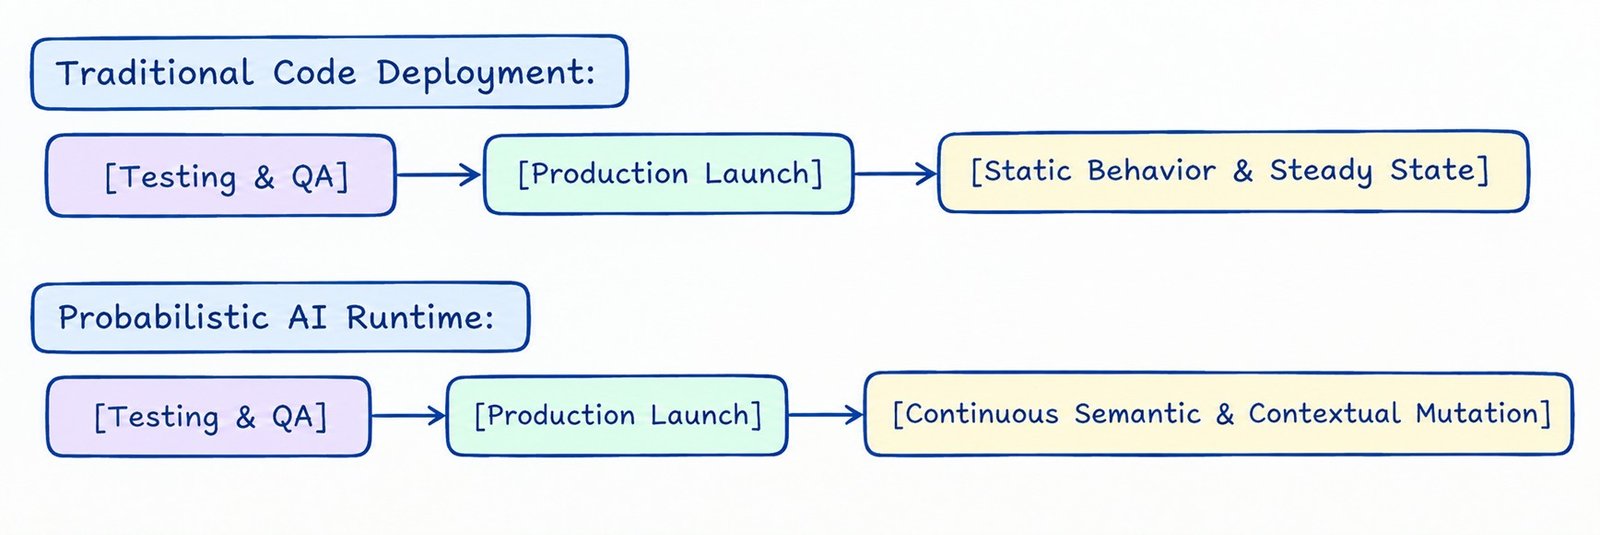
For technology leaders, ensuring long-term reliability requires moving away from manual, periodic validation checks. You must establish an automated framework for continuous semantic performance monitoring and real-time statistical drift tracking. This section details the patterns required to run real-time evaluation scorecards, compute statistical distance across high-dimensional vector embeddings, and build automated guardrails that flag production model decay before it impacts business operations.
1. Model Performance Monitoring
Evaluating non-deterministic language generation at scale requires moving beyond simple keyword matching or regex rules. To monitor production systems effectively, applications must implement real-time scoring pipelines using framework standards such as Ragas and TruLens. This approach transforms abstract linguistic quality into concrete, measurable engineering metrics.
Real-Time RAG Triplet Diagnostics
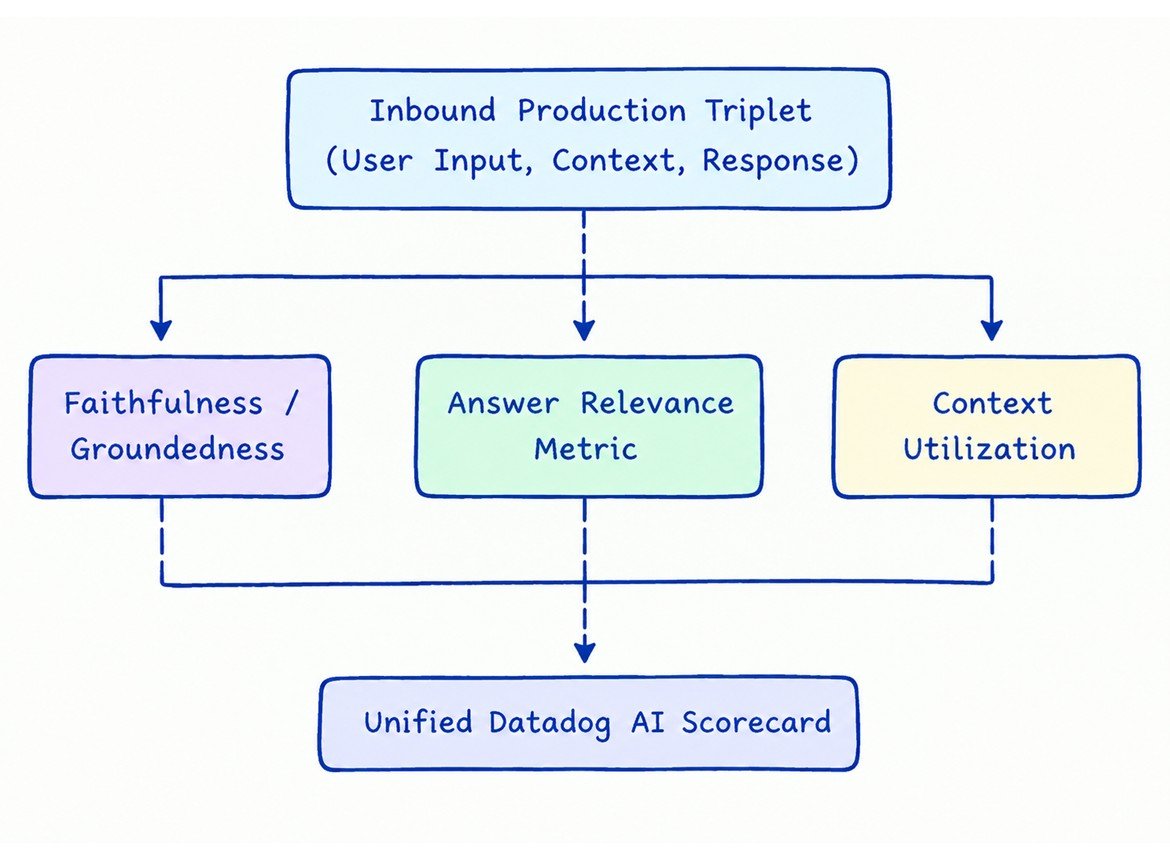
The core of your production evaluation strategy centers on the RAG Triplet framework. This methodology assesses three distinct relationships within a Retrieval-Augmented Generation transaction to isolate performance issues:
- Faithfulness and Groundedness (Response vs. Context): This metric evaluates whether the model's generated output relies strictly on the retrieved source text. If the model introduces facts or assumptions not present in the reference documents, the system flags a potential hallucination.
- Answer Relevance (Response vs. User Query): This metric measures how directly the generated response addresses the user's initial question. A low relevance score indicates that the model is generating off-topic answers or failing to follow formatting instructions.
- Context Utilization (Context vs. User Query): This metric evaluates whether the retrieval engine is pulling the most precise, high-value source information needed to answer the user's prompt. Low utilization scores point to issues within your chunking strategy or vector index configuration.
Production Implementation: Ragas & TruLens Asynchronous Scoring Pipeline
The following implementation demonstrates a production-ready asynchronous scoring pipeline. It captures the production transaction triplet, calculates core evaluation metrics using Ragas and TruLens conventions, and exports the resulting data directly to Datadog custom metric registers.
import os
import asyncio
from typing import Dict, Any
from datadog import statsd
from ragas.metrics import faithfulness, answer_relevance
from ragas import evaluate
from datasets import Dataset

class RealTimePerformanceEvaluator:
    def __init__(self, consumer_tenant: str):
        self.tenant = consumer_tenant
        # Configure target evaluation standards
        self.active_metrics = [faithfulness, answer_relevance]

    async def evaluate_transaction_async(
        self,
        user_query: str,
        retrieved_context: str,
        generated_response: str
    ) -> Dict[str, float]:
        """Calculates triplet scores asynchronously without delaying the primary chat flow."""
        try:
            # 1. Structure the production runtime transaction into a validation dataset
            transaction_data = {
                "question": [user_query],
                "contexts": [[retrieved_context]],
                "answer": [generated_response]
            }
            dataset = Dataset.from_dict(transaction_data)

            # 2. Run evaluation calculations using background thread workers
            loop = asyncio.get_event_loop()
            eval_result = await loop.run_in_executor(
                None,
                lambda: evaluate(dataset, metrics=self.active_metrics)
            )

            # 3. Parse output score calculations
            scores = {
                "faithfulness": float(eval_result.get("faithfulness", 0.0)),
                "answer_relevance": float(eval_result.get("answer_relevance", 0.0))
            }

            # 4. Stream evaluation values to the centralized Datadog metric pipeline
            self._emit_telemetry_to_datadog(scores)
            return scores

        except Exception as eval_fault:
            statsd.increment("ai.evaluation.pipeline.failure", tags=[f"tenant:{self.tenant}"])
            # Log failure details internally while keeping main application alive
            return {"faithfulness": 0.0, "answer_relevance": 0.0}

    def _emit_telemetry_to_datadog(self, score_map: Dict[str, float]):
        """Binds evaluation scores directly to custom Datadog monitoring metrics."""
        for metric_name, score_value in score_map.items():
            statsd.gauge(
                f"ai.model.performance.{metric_name}",
                score_value,
                tags=[f"tenant:{self.tenant}", "environment:production"]
            )
2. Data and Concept Drift Detection
While runtime scorecards evaluate individual response outputs, system reliability requires tracking aggregate shifts across all incoming user interactions. Over time, the distribution of production data can drift away from the original training data or baseline RAG document collections. This shift can cause silent declines in system accuracy.
Embedding-Based Statistical Drift Tracking
Traditional drift detection algorithms analyze tabular data across simple numerical fields. For unstructured language applications, your system must track drift across high-dimensional vector embeddings.
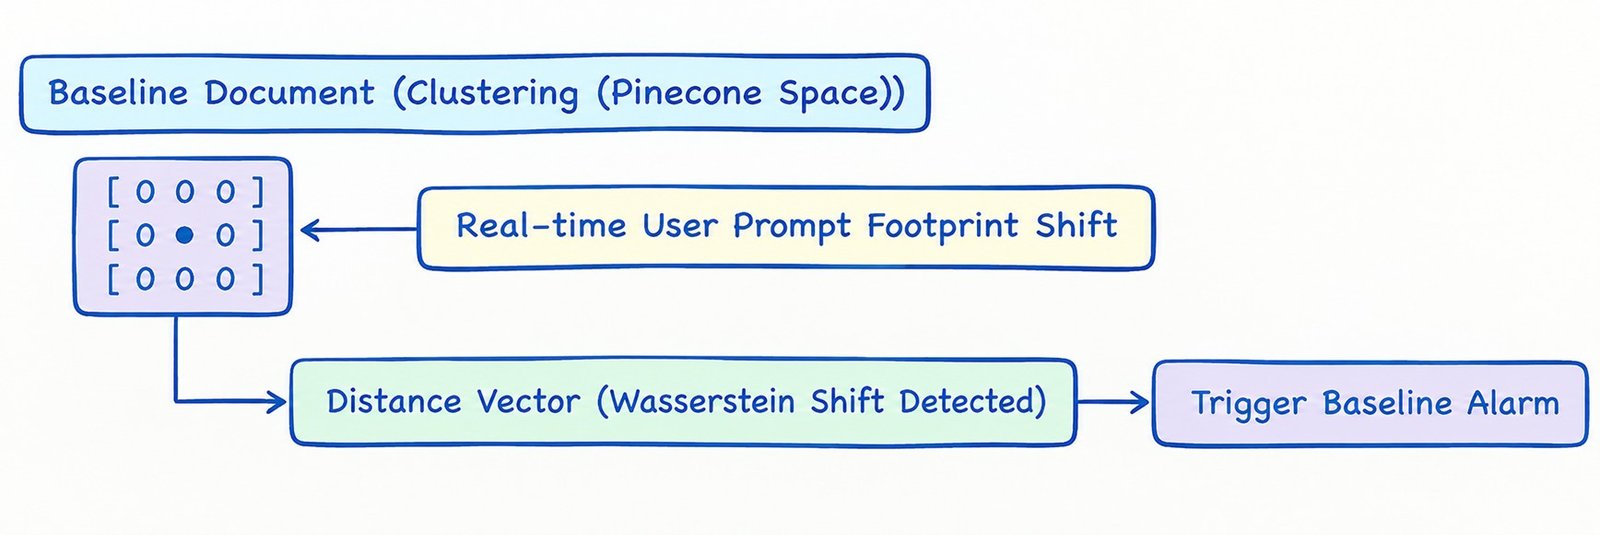
By computing embedding vectors for incoming user queries and logging them to a high-performance vector index, such as Pinecone, your telemetry pipeline can continuously track semantic shifts between production traffic and established reference baselines.
Implementing Population Stability Index (PSI) and Wasserstein Distance
To identify system degradation before it impacts users, your telemetry pipelines should compute two primary statistical measures across the embedding space:
- Population Stability Index (PSI): This metric divides the embedding distribution into discrete bins based on defined variance boundaries. It then measures changes in the distribution of production inputs relative to the baseline, allowing teams to detect statistically significant shifts in incoming user behavior.
- Wasserstein Distance (Earth Mover's Distance): This metric treats the embedding distributions as continuous probability distributions. It measures the minimum amount of distributional movement required to transform the production prompt distribution into the baseline reference distribution.

A steady increase in the Wasserstein distance indicates that user behavior is shifting away from the available knowledge bases.
Metric-Driven Maintenance Schedules
The following playbook outlines how teams should respond when statistical drift thresholds are crossed in production dashboards:
| Drift Score Value | System Status | Expected Technical Impact | Core Remediation Action |
|---|---|---|---|
| PSI < 0.10 | Green (Stable State) | Production inputs align tightly with the RAG knowledge base. | No intervention required. Maintain standard telemetry streaming. |
| PSI: 0.10 - 0.25 | Yellow (Moderate Shift) | User inputs are shifting. You may see gradual declines in retrieval accuracy. | Trigger automatic pipeline alerts. Schedule a refresh of the Pinecone index documents. |
| PSI > 0.25 | Red (Severe Degradation) | Production traffic has drifted significantly from system baselines. High risk of hallucinations. | Route traffic to safety fallbacks. Automatically initiate a baseline index rebuild. |
3. Streaming Inline Drift Tracking Architecture
To detect systemic model degradation early, you cannot rely entirely on daily batch jobs. If a sudden market event or operational shift causes user behavior to change dramatically, a batch evaluation framework may not surface the issue for several hours.
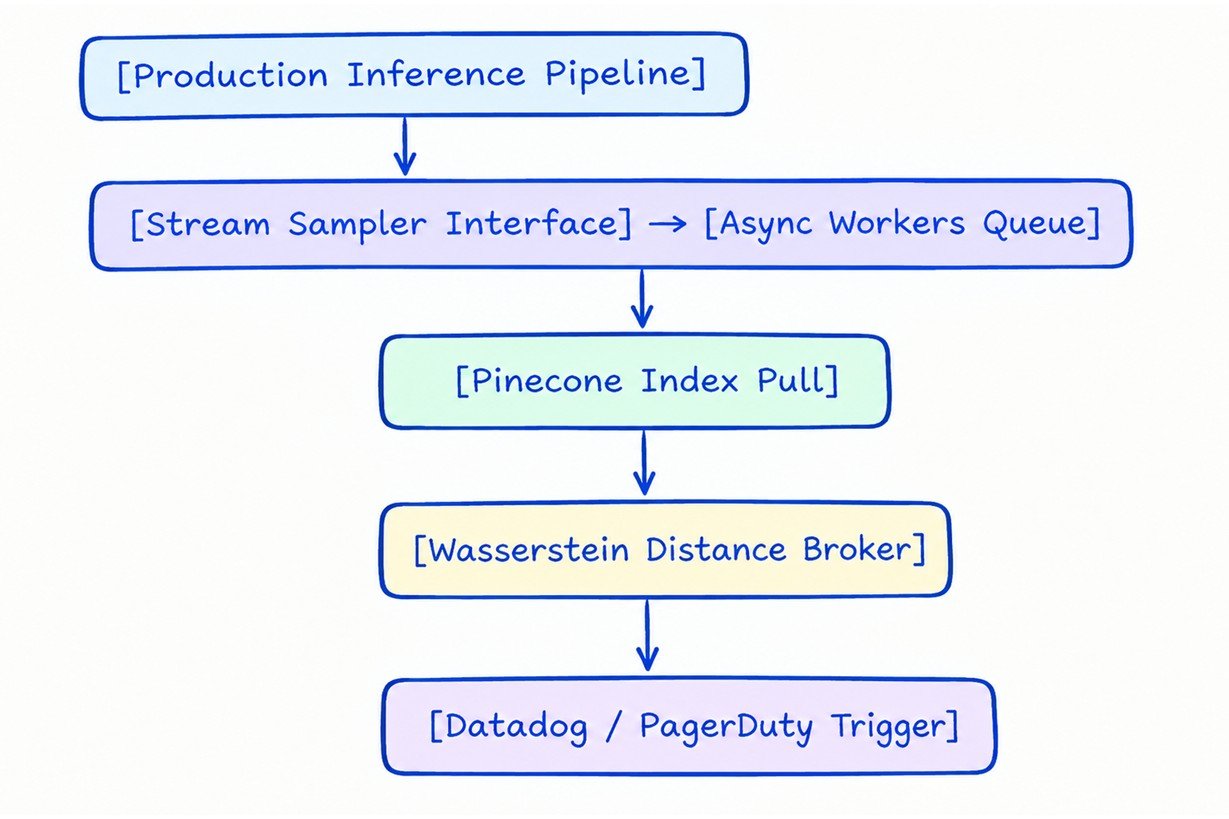
Your architecture must use a streaming inline drift-tracking pipeline that evaluates data windows continuously and directly from the inference stream.
Real-Time Streaming Ingestion Loops
When an inference worker completes a transaction, it dispatches the calculated prompt embedding vector asynchronously to a localized processing queue.
Streaming drift-analysis workers consume these vectors using a sliding-window approach, such as evaluating the most recent 1,000 requests, and calculate distance metrics against a reference baseline cache derived from your primary Pinecone indices.
High-Speed Vector Analytics Using Pinecone
To compute multi-dimensional distance calculations efficiently without introducing significant infrastructure overhead, your drift-tracking workers can query target coordinate maps directly within Pinecone.
The drift workers query the master Pinecone index using a representative sample of production vectors to evaluate the local density of the embedding space. If the average distance across these queries exceeds defined warning thresholds, the system triggers alerts directly in Datadog metric dashboards.
Automated Mitigation Pipelines
When statistical drift triggers an alarm, your system should initiate automated remediation steps to protect system performance:
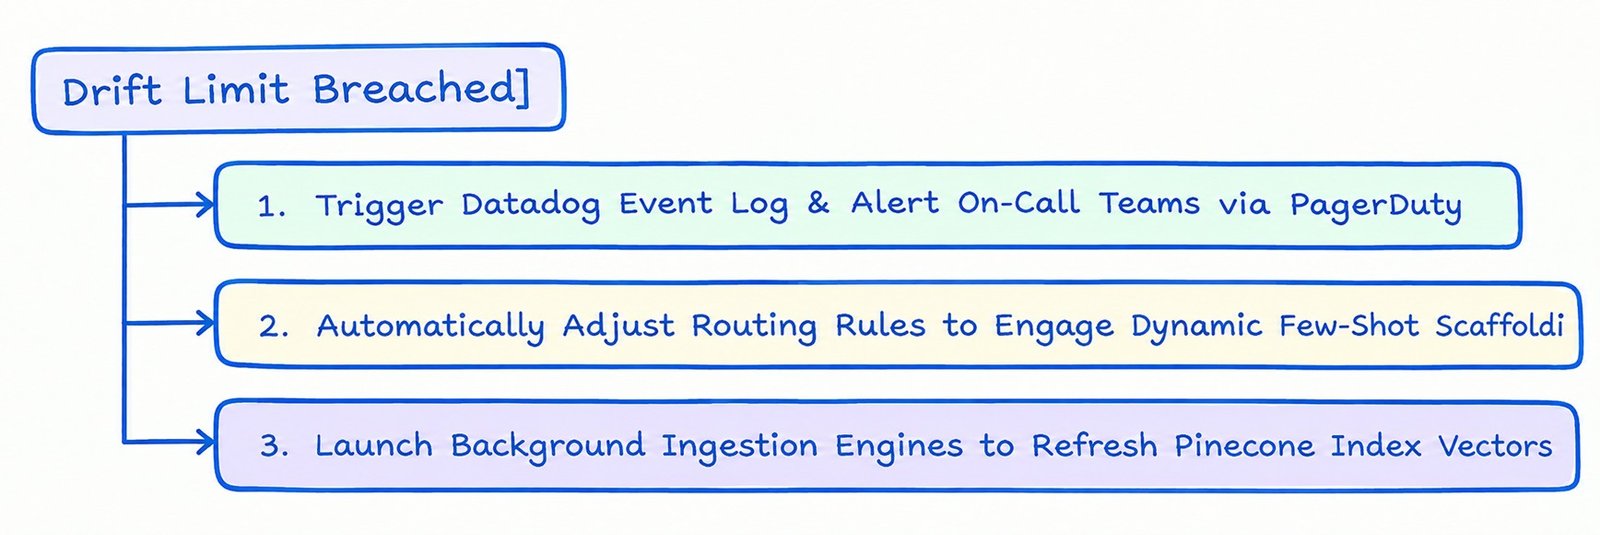
- System Alerts: The drift engine logs a high-severity alert in Datadog, which routes the event through PagerDuty to notify platform engineering teams immediately.
- Adaptive Scaffolding: The system adjusts routing configurations for affected application paths, switching from zero-shot prompts to detailed few-shot scaffolds to help the model handle the evolving user data distribution.
- Automated Index Updates: The system triggers backend data connectors to retrieve the latest enterprise reference documents, re-embed the content, and update the target Pinecone index records to keep the RAG system aligned with current user behavior.
Executive Architectural Summary
Maintaining long-term reliability in an enterprise AI system requires moving from static validation testing to continuous performance monitoring. By running real-time evaluation scorecards through Ragas and TruLens, monitoring high-dimensional embedding spaces, and deploying streaming drift-tracking pipelines integrated directly with Datadog, you can ensure that your generative AI platforms remain accurate, stable, and resilient at scale.