Distributed Observability and AI Telemetry Pipelines
Introduction
Monitoring traditional deterministic architectures relies on a well-understood three-pillar paradigm: metrics, logs, and traces. In standard microservice architectures, an edge request triggers a synchronous cascade of database queries and internal RPC calls. Performance is measured linearly using CPU cycles, memory footprints, and network transaction boundaries.
However, generative AI runtimes break classical observability models. Standard application tracing tools treat an LLM call as a basic black-box HTTP request. They capture network transit times and status codes, but completely miss the internal variables that dictate system behavior: context window allocations, embedding retrieval steps, token generation speeds, and the dynamic execution loops of autonomous agents.
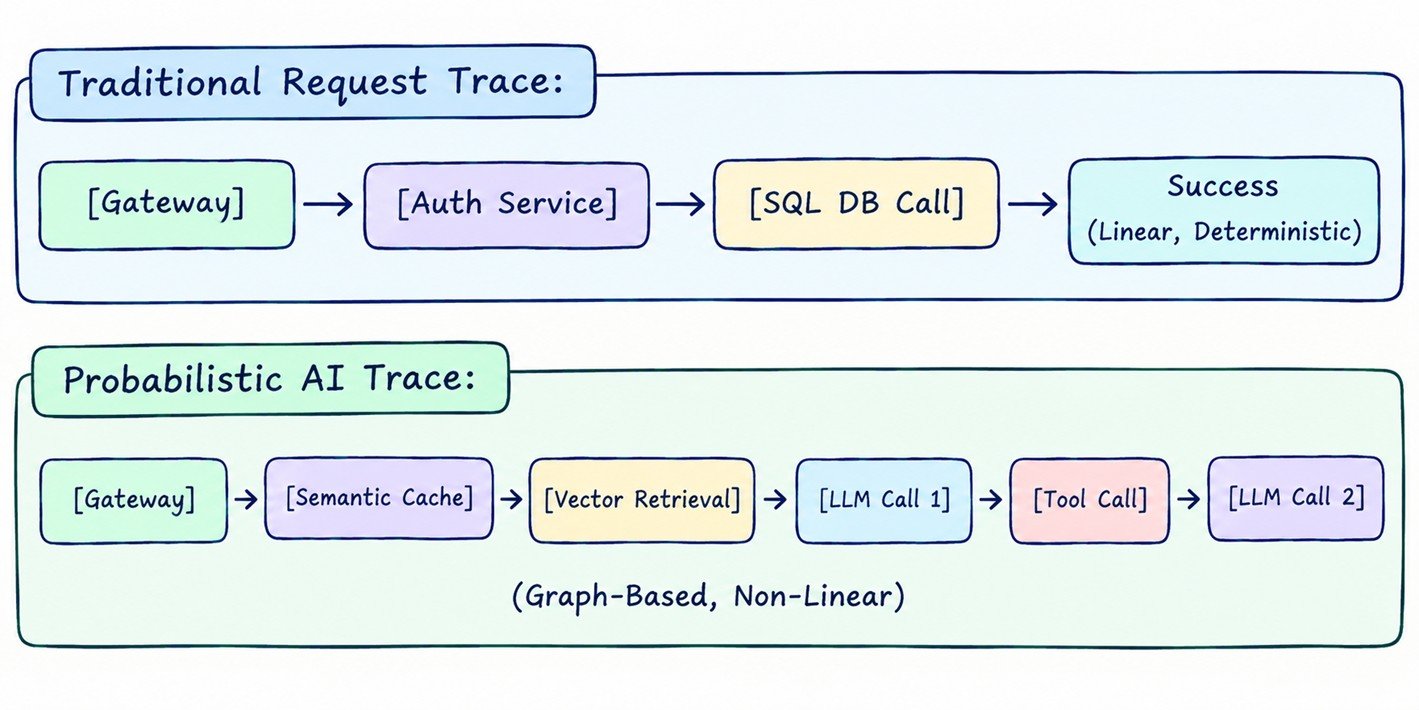
For engineering leaders, operating a production-grade AI system requires establishing complete visibility into this non-deterministic lifecycle. You must build an observability architecture that goes beyond simple application uptime monitoring. This section provides the design patterns needed to architect distributed, context-aware AI telemetry pipelines that capture the full execution paths of probabilistic systems while maintaining strict enterprise compliance and performance bounds.
1. Distributed Tracing in Agentic Workflows
Autonomous multi-agent systems and advanced Retrieval-Augmented Generation (RAG) pipelines generate highly complex execution paths. A single user prompt can trigger parallel semantic vector queries, prompt optimization rewrites, multiple sequential foundation model calls, and external tool executions. If these sub-steps are not explicitly tied together, identifying the root cause of a latency spike or reasoning failure becomes nearly impossible.
Graph-Based Trace Propagation with W3C Context Standards
To trace complex agent operations accurately, your system must treat the entire lifecycle as an asynchronous directed acyclic graph (DAG). You can implement this by extending the W3C Trace Context specification, which standardizes how tracing metadata moves across distributed architectures via two distinct header components:
traceparent: A globally unique, single identifier string that links every microservice call back to the original client request.tracestate: A key-value system optimized for system-specific metadata. In an AI platform, this structure carries critical operational state: the identifier of the active orchestrator framework, the identifier of the processing tenant, and routing instructions for the target model.
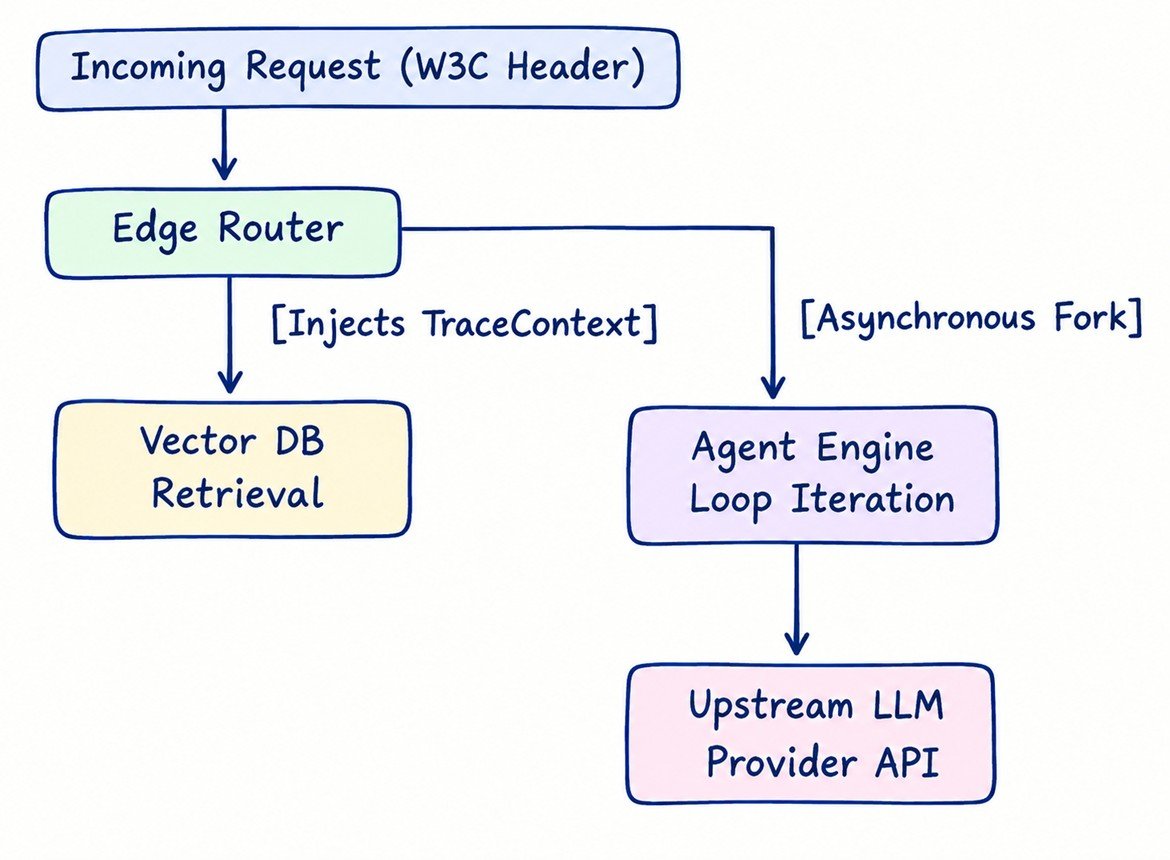
When an agent schedules an asynchronous tool task or triggers a parallel model routing path, the orchestration layer must inject these tracing attributes into the execution context. Downstream components, such as vector databases, search tools, or internal fine-tuned models, extract these identifiers and log their execution details under the same unified trace tree.
OpenTelemetry Semantic Conventions for AI
Traditional APM tools lack the structural concepts needed for AI data. To address this, your platform should implement the OpenTelemetry (OTel) Semantic Conventions for Generative AI. This approach extends standard span metrics to capture key model execution variables explicitly:
gen_ai.system: "openai" | "anthropic" | "vllm"
gen_ai.request.model: "claude-3-5-sonnet-v2"
gen_ai.request.temperature: 0.2
gen_ai.response.finish_reasons: ["stop_sequence"]
gen_ai.usage.prompt_tokens: 14205
gen_ai.usage.completion_tokens: 312
By enforcing these semantic schemas across your enterprise services, your infrastructure teams can build unified dashboards that directly correlate standard system performance, such as network latency, with critical AI metrics, such as token generation speeds and model finish codes.
2. AI Telemetry Frameworks
Building an enterprise-scale telemetry pipeline presents a significant data engineering challenge. A high-volume AI system processes millions of tokens every second. If you attempt to log every raw prompt payload, vector similarity score, and token stream chunk synchronously, you risk saturating your application network layers and exhausting your storage infrastructure.
Asynchronous High-Throughput Ingestion Pipelines
To capture telemetry data without impacting system performance, you must isolate the telemetry collection pipeline completely from the main inference path. Applications should emit tracking data asynchronously using memory-buffered OpenTelemetry Protocol (OTLP) exporters.
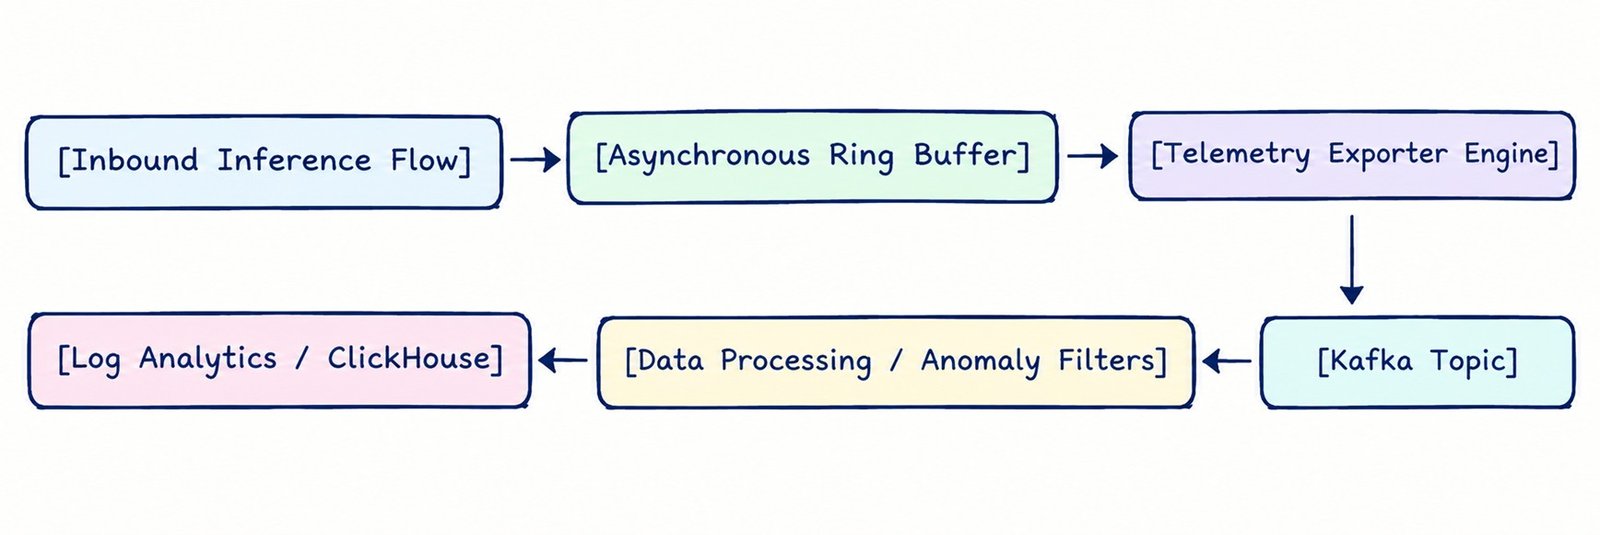
These OTLP exporters bundle spans and dispatch them via non-blocking background workers to a centralized messaging queue, such as Apache Kafka. A dedicated tier of telemetry workers processes this queue, parsing the tracking graphs, calculating operational costs, and storing the processed data in a high-speed time-series columnar store, such as ClickHouse, optimized for long-term analytical queries.
Adaptive Sampling and Anomaly-Driven Storage Filters
Storing every single successful log entry across thousands of daily conversations creates unnecessary infrastructure costs. To manage this storage footprint efficiently, your system should employ an adaptive tail-sampling strategy:
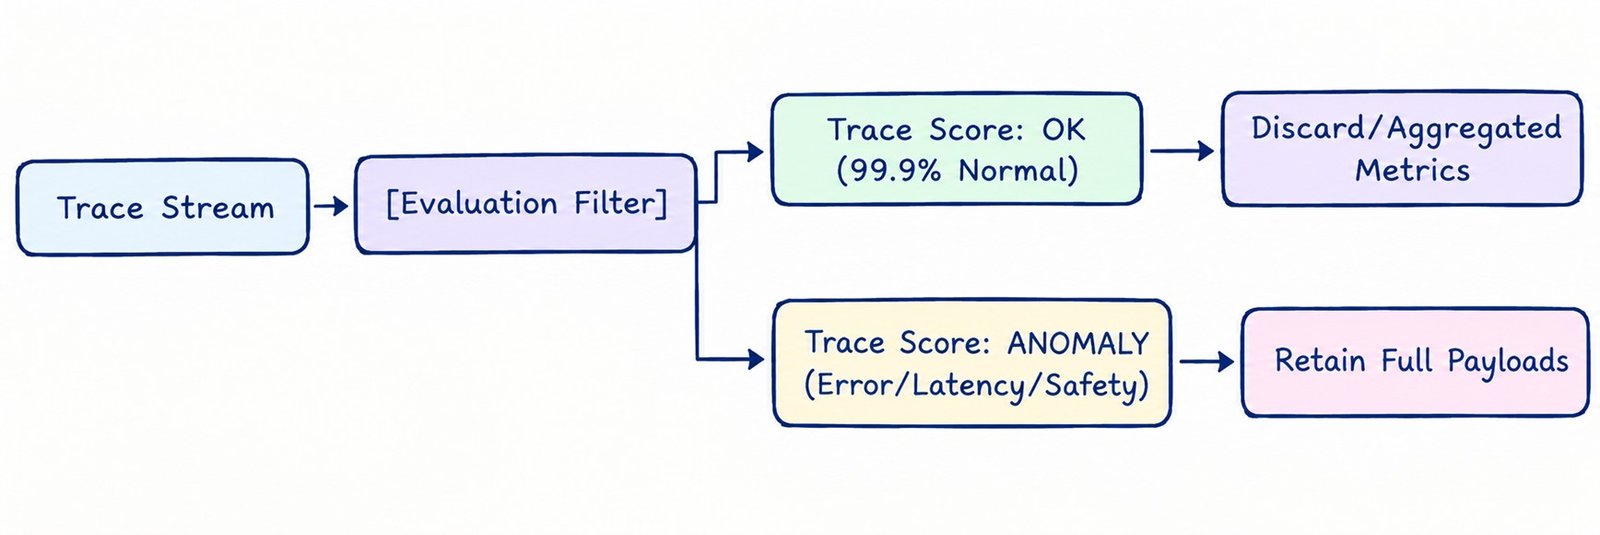
Under normal operating conditions, the telemetry worker logs only light, aggregated structural metrics, such as total token counts and response latency, while discarding the heavy text payloads.
However, if a transaction triggers a system error, experiences a severe latency spike, or returns a low semantic score from a RAG validation check, the system flags the trace as an anomaly. The pipeline captures and stores the entire trace structure, preserving the full conversation history for deep engineering review.
Code Implementation: OpenTelemetry AI Context Tracing
The following production-grade implementation shows an asynchronous orchestration wrapper that implements graph-based distributed tracing using OpenTelemetry SDKs, explicitly capturing model parameters and chunk performance metrics.
import time
import asyncio
from typing import AsyncGenerator, Dict, Any
from opentelemetry import trace
from opentelemetry.trace import Status, StatusCode

# Initialize the enterprise core tracer instance
tracer = trace.get_tracer("enterprise.ai.observability")

class ContextAwareTraceOrchestrator:
    def __init__(self, model_provider: str, model_name: str):
        self.model_provider = model_provider
        self.model_name = model_name

    async def trace_inference_lifecycle(
        self,
        prompt: str,
        temperature: float,
        raw_stream_provider: AsyncGenerator[Dict[str, Any], None]
    ) -> AsyncGenerator[Dict[str, Any], None]:

        # 1. Establish an explicit telemetry span boundary
        span_name = f"gen_ai.completion:{self.model_name}"

        with tracer.start_as_current_span(span_name) as span:
            # Set standardized OpenTelemetry AI conventions
            span.set_attribute("gen_ai.system", self.model_provider)
            span.set_attribute("gen_ai.request.model", self.model_name)
            span.set_attribute("gen_ai.request.temperature", temperature)
            span.set_attribute("gen_ai.prompt", prompt) # Secured via compliance gateway upstream

            start_time = time.time()
            token_count = 0
            full_response_buffer = []

            try:
                # 2. Iterate over the incoming asynchronous streaming tokens
                async for chunk in raw_stream_provider:
                    if token_count == 0:
                        # Capture Time to First Token (TTFT) metrics explicitly
                        ttft_duration = time.time() - start_time
                        span.set_attribute("gen_ai.metrics.ttft", ttft_duration)

                    token_text = chunk.get("text", "")
                    full_response_buffer.append(token_text)
                    token_count += 1

                    # Yield token chunk downstream immediately to avoid user latency block
                    yield chunk

                # 3. Post-execution telemetry processing
                execution_duration = time.time() - start_time
                span.set_attribute("gen_ai.metrics.duration", execution_duration)
                span.set_attribute("gen_ai.usage.completion_tokens", token_count)
                span.set_attribute("gen_ai.response.output_text", "".join(full_response_buffer))

                span.set_status(Status(StatusCode.OK))

            except Exception as system_exception:
                # 4. Handle exceptions cleanly within the trace schema
                span.record_exception(system_exception)
                span.set_status(Status(StatusCode.ERROR, description=str(system_exception)))
                raise system_exception
3. Prompt and Response Observability
Managing an enterprise AI platform requires treating prompt templates as dynamic code assets. In production, a user's prompt is rarely sent as simple raw text; it is constructed using multi-shot template injections, variables pulled from corporate databases, and system guardrail prefixes.
To debug a model's logical failures or safety violations, engineers must be able to view the exact, final prompt payload sent to the model backend, along with the precise context state at that moment.
Privacy-Preserving Semantic Logging Networks
Logging full raw text payloads creates major compliance risks. In a regulated industry, prompts often contain protected health information (PHI), personally identifiable information (PII), or confidential corporate financial data.
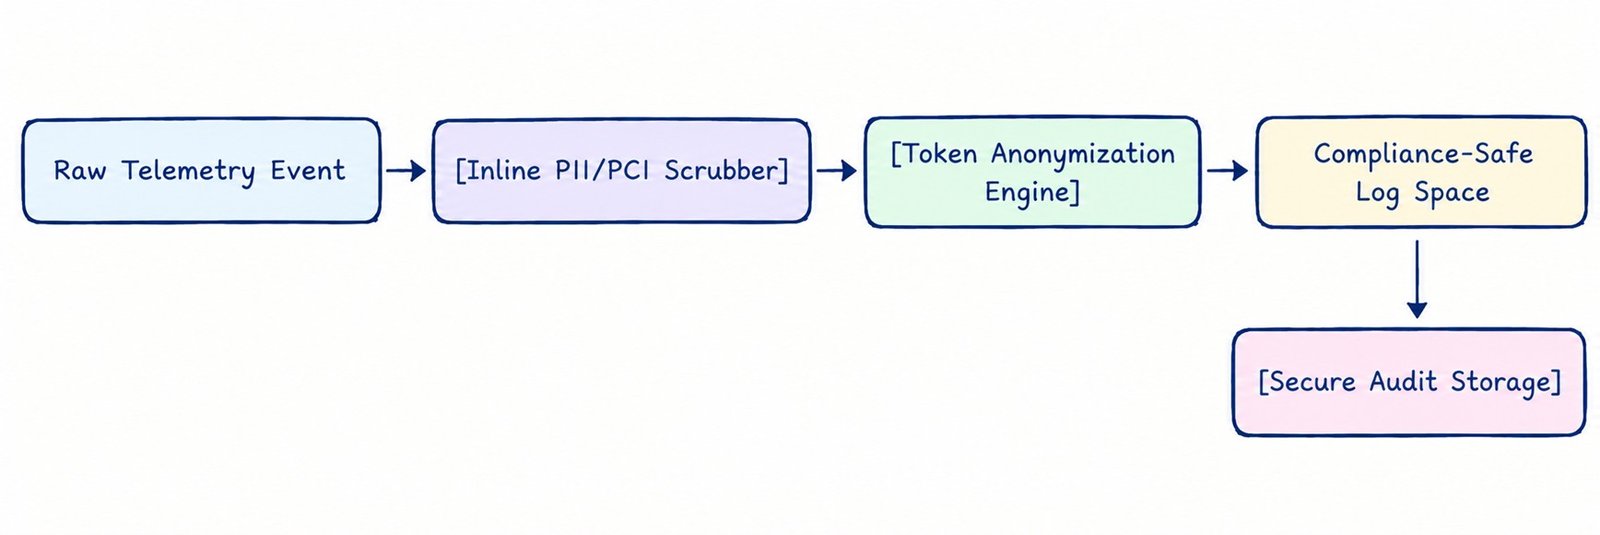
To maintain visibility without violating data privacy regulations, you must place an inline token scrubbing layer directly inside your telemetry egress framework:
- PII/PCI Masking Filters: Before writing telemetry events to disk, route payloads through an automated, high-speed classification model, such as Microsoft Presidio, to detect and redact sensitive data fields, such as credit card numbers or social security codes.
- Deterministic Token Anonymization: Replace real names or unique account IDs with consistent, non-reversible hashes. This maintains the structural format of the log message, allowing engineers to trace multi-turn conversations accurately without exposing actual user data.
- Role-Based Security Zones: Restrict access to raw text logs using strict access controls. Store raw text payloads in isolated, short-retention object stores for real-time debugging, while using redacted schemas for long-term trend analysis and training datasets.
Version Control and Semantic Drift Tracking
A model's performance can drift over time due to subtle prompt adjustments or silent backend updates by the provider. To track these changes accurately, your observability architecture must group logs by clear prompt versions and deployment tags.
| Observability Vector | Primary Source Tracker | Enterprise Diagnostic Value | Core Analytical Approach |
|---|---|---|---|
| Systemic Prompt Drift | Prompt Management System Registry. | Detects if small prompt changes cause drops in task accuracy. | A/B Validation Metrics, Semantic Score Compilers. |
| Provider Model Shift | Upstream API Version Tags. | Flags silent backend updates that alter model formatting or reasoning logic. | Structural Validation Audits, Output Pattern Checks. |
| Semantic Vector Drift | Embedding Space Profiles. | Tracks if user inputs are shifting away from your RAG knowledge base. | Cosine Similarity Tracking, Dynamic Clustering Pools. |
By tracking these vectors closely, your platform engineering teams can easily isolate whether a drop in accuracy stems from an internal application prompt change or an external provider model update.
Dynamic Semantic Drift Tracking
To monitor user behavior patterns and track changes in your RAG data over time, your telemetry pipeline should compute embedding vectors for a randomized sample of incoming user prompts.
By comparing these input embedding vectors against a baseline coordinate map using cosine similarity calculations, you can track user interest trends and identify when inputs are shifting away from your vector knowledge base. This metrics data gives your teams the early warning signals needed to refresh enterprise data stores before RAG retrieval accuracy drops.
4. Datadog Native LLM Observability & Core Dashboards
To scale these requirements within an enterprise production context, telemetry collection must integrate into Datadog's centralized observability ecosystem. Rather than maintaining isolated visualization servers, teams should use Datadog's native APM, Custom Metrics, and Log Pipelines to provide technology leaders with a single pane of glass spanning traditional infrastructure metrics and probabilistic AI runtimes.
Unified APM Tracing for AI Microservices
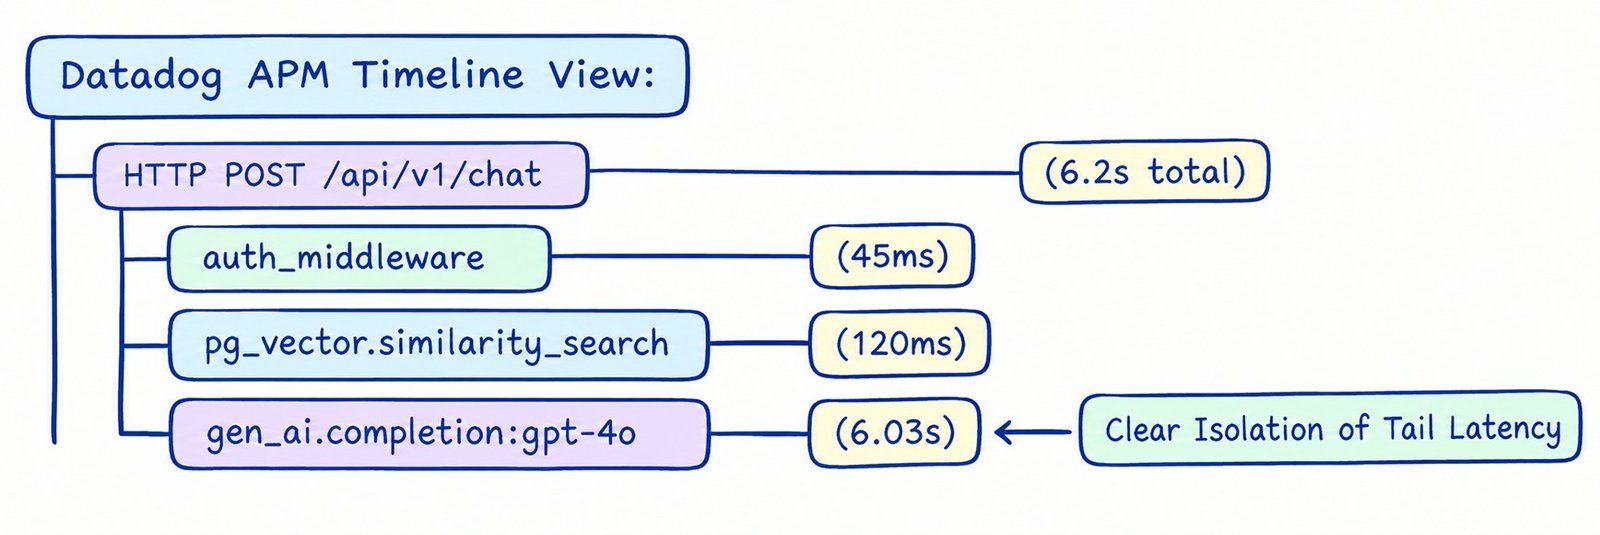
Datadog tracks standard request components natively, but isolating an inference bottleneck requires mapping LLM performance alongside classical execution layers.
By connecting the OpenTelemetry ingestion stream to the Datadog Agent Collector, standard OTel semantic fields automatically populate within Datadog APM views. Engineers can analyze an execution graph and pinpoint precisely whether a 6-second delay was caused by a database connection lockup or a slow token-processing stream on an upstream cluster.
Multi-Dimensional Dashboards and Key Performance Alarms
Enterprise operations teams should set up customized Datadog core dashboards focused on four critical pillars:
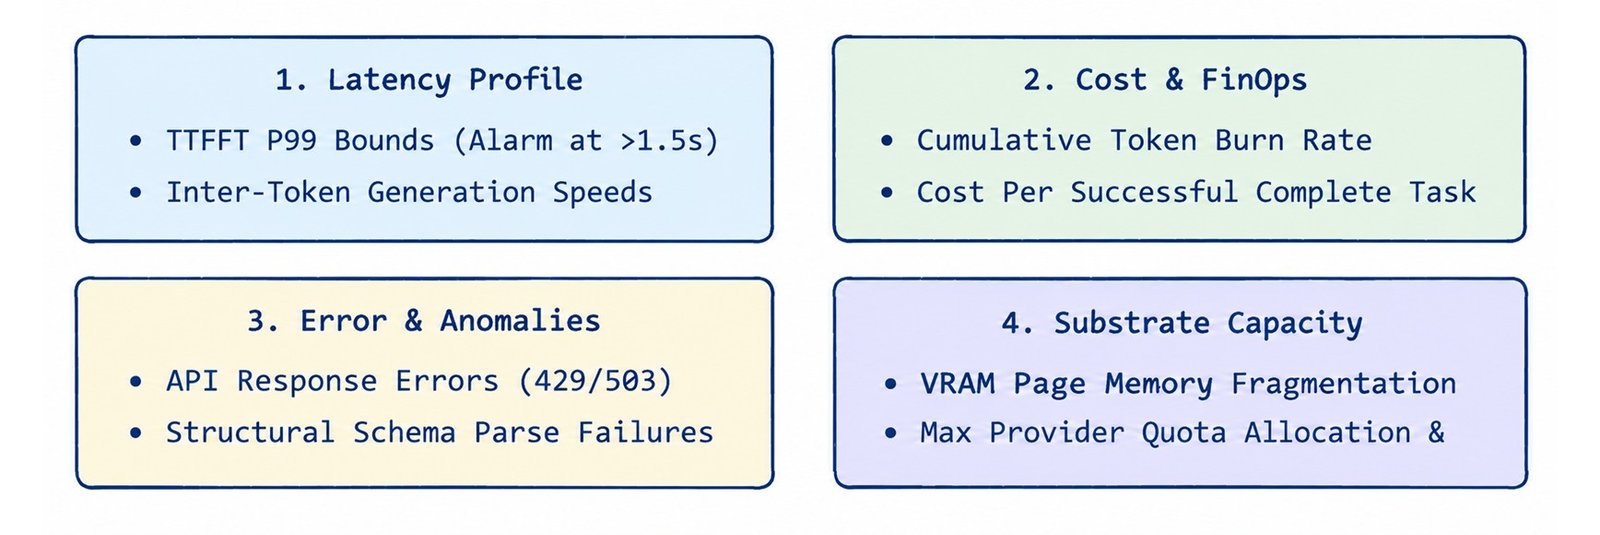
By establishing statistical anomaly detectors on these specific performance attributes, Datadog can automatically trigger on-call alerts via PagerDuty before runtime degradation causes widespread user application dropouts.
5. Multi-Framework Compliance Scaffolding (HIPAA, GDPR, SOC 2, PCI-DSS)
Operating production AI platforms within highly regulated environments requires strict adherence to security frameworks. Generative AI systems introduce volatile memory allocations and dynamic text generation that complicate standard security boundary enforcement.
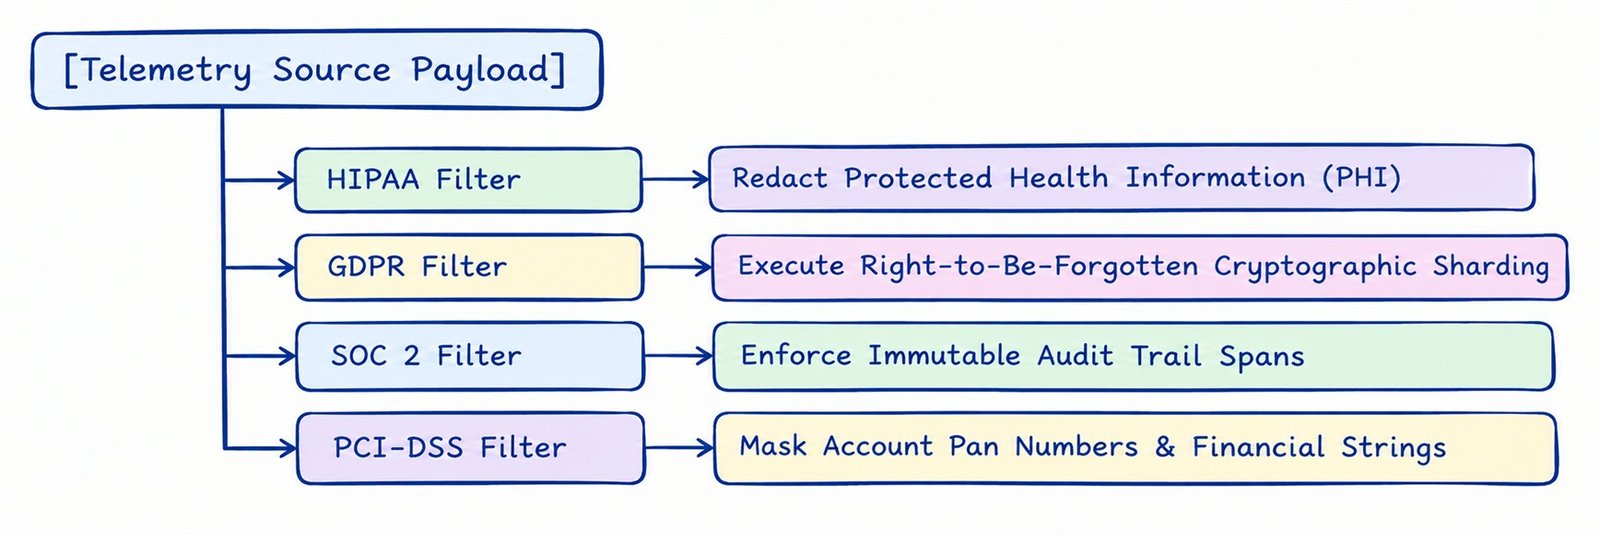
To ensure compliance across HIPAA, GDPR, SOC 2, and PCI-DSS, your telemetry platform must implement a zero-trust compliance architecture directly on the data stream.
HIPAA & PCI-DSS Pipeline Controls
Under HIPAA guidelines, medical record numbers, facial data, or clinical statements constitute Protected Health Information (PHI). Similarly, PCI-DSS strictly forbids storing unencrypted Primary Account Numbers (PANs) or sensitive authentication data.
- Boundary Enforcement: Telemetry event engines must employ strict field classification. Any unstructured payload string passed within a prompt context must pass through a local classification sandbox before it leaves the compliance boundary.
- Static Redaction Gateways: If a credit card token or medical reference pattern is identified by the parsing gateway, the telemetry span replaces the data string with a secure placeholder tag, such as
[REDACTED_PCI_PAN]. This pattern ensures that no production databases or downstream Datadog log clusters ever ingest or index cleartext compliance data.
GDPR & SOC 2 Telemetry Alignment
GDPR establishes strict guidelines for data privacy, including the explicit Right to be Forgotten (Article 17). This presents a unique challenge for AI teams because prompts stored in analytical logs can act as permanent records of user interaction.
- Cryptographic Shredding Architecture: To comply with Article 17, do not mix raw prompt logs inside static database tables. Instead, encrypt user interaction streams using a distinct consumer decryption key hosted in an enterprise key vault. If a customer requests total data erasure, revoke and delete that unique consumer cryptographic key. The logged prompt text then becomes unreadable, completing data erasure without breaking historical time-series log structures.
- SOC 2 Trust Principles (Security & Confidentiality): To pass SOC 2 audits, every system change or structural runtime model alteration must generate an immutable log span. Your architecture must track every manual prompt change, vector schema modification, and administrative configuration update, logging these events directly to an isolated, append-only security auditing service.
6. Orchestration Tracing Mechanics in LangChain and LangGraph
When building multi-step reasoning applications using LangChain and multi-agent systems using LangGraph, monitoring becomes significantly more difficult. These frameworks hide complex state transitions, prompt-generation loops, and tool-switching logic behind simple abstractions.
If an agent becomes stuck in a loop or makes incorrect tool choices, standard web tracers see only a long, opaque execution delay.
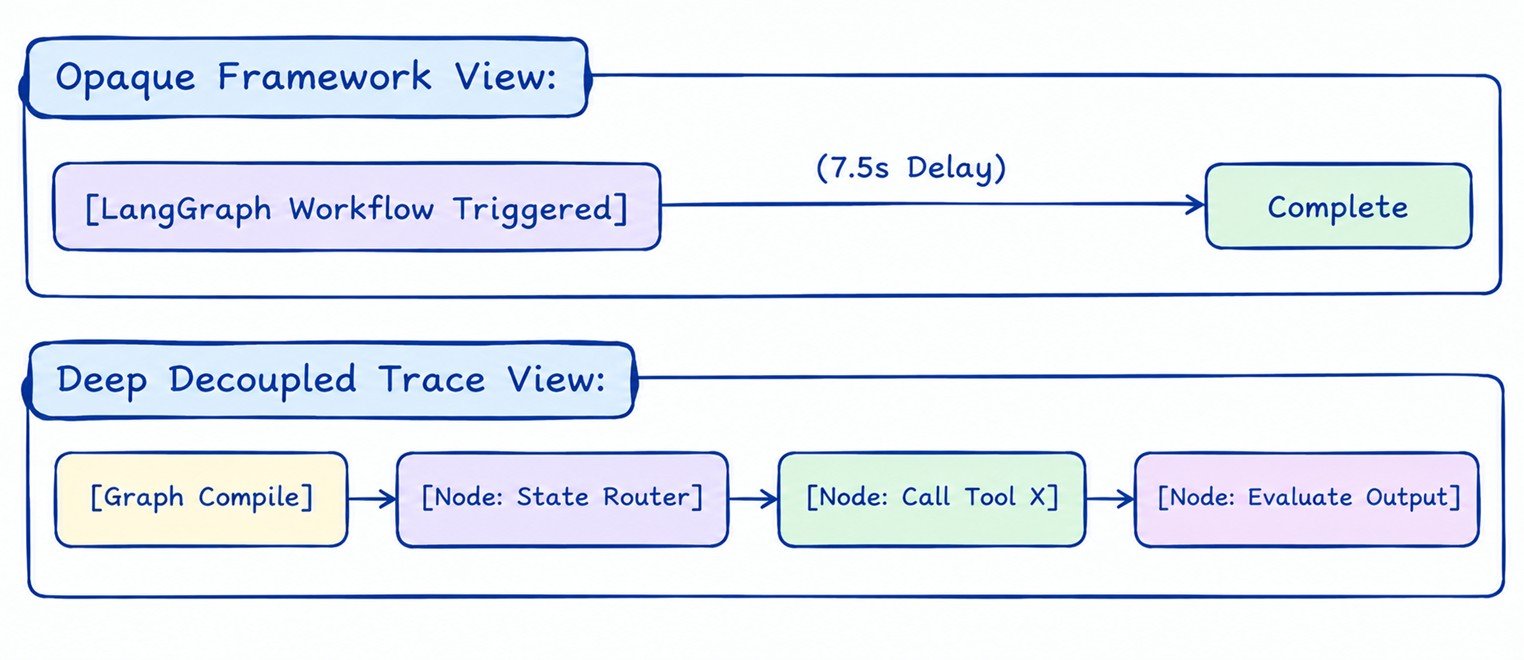
To break open this black box, the platform must use explicit tracing mechanisms to record every internal state change and tool-execution graph cleanly.
Deep Telemetry Lifecycle Hooks
To extract contextual data from LangChain and LangGraph engines without modifying production business logic, implement framework-native event collectors. These collection listeners run completely out-of-band, capturing execution telemetry without affecting runtime performance:
- LangChain
BaseCallbackHandlerIntegration: Inherit the framework callback interfaces to map operational events directly to OpenTelemetry span layers. The telemetry listener captures exact prompt-rendering metrics, model invocation parameters, and framework tool-execution states, passing this data directly into the active tracing context. - LangGraph State Run-Graph Visualizer: LangGraph relies on state transitions between nodes. The callback framework captures state changes at every node boundary, logging the full routing pathway, active loop counts, and tool-return data to ensure complete execution transparency.
Production Implementation: LangChain/LangGraph OTel Callback Broker
The following production-grade implementation demonstrates a customized LangChain and LangGraph callback handler that automatically extracts framework execution state and surfaces it as structured OpenTelemetry attributes.
from typing import Any, Dict, List, Optional
from uuid import UUID
from langchain_core.callbacks import BaseCallbackHandler
from langchain_core.outputs import LLMResult
from opentelemetry import trace
from opentelemetry.trace import Status, StatusCode

# Active tracer connection to enterprise telemetry pipelines
tracer = trace.get_tracer("enterprise.ai.framework_monitor")

class LangChainTelemetryBroker(BaseCallbackHandler):
    def __init__(self, execution_tenant: str):
        super().__init__()
        self.execution_tenant = execution_tenant
        # Maintain an internal reference system to link asynchronous parent tasks
        self.active_spans: Dict[str, Any] = {}

    def on_llm_start(
        self, serialized: Dict[str, Any], prompts: List[str], *,
        run_id: UUID, parent_run_id: Optional[UUID] = None, **kwargs: Any
    ) -> None:
        """Fires instantly when an internal LangChain/LangGraph model invocation starts."""
        span_name = f"langchain.node.llm:{serialized.get('id', ['unknown'])[-1]}"

        # Start a structured distributed telemetry span
        span = tracer.start_span(span_name)
        span.set_attribute("framework", "langchain")
        span.set_attribute("tenant.id", self.execution_tenant)
        span.set_attribute("gen_ai.prompts.count", len(prompts))

        # Safely map parental relation links for LangGraph loop tracing
        if parent_run_id:
            span.set_attribute("parent.run_id", str(parent_run_id))

        self.active_spans[str(run_id)] = span

    def on_llm_end(self, response: LLMResult, *, run_id: UUID, **kwargs: Any) -> None:
        """Fires cleanly as soon as the active model execution closes successfully."""
        span = self.active_spans.pop(str(run_id), None)
        if span:
            token_usage = response.llm_output.get("token_usage", {}) if response.llm_output else {}
            span.set_attribute("gen_ai.usage.prompt_tokens", token_usage.get("prompt_tokens", 0))
            span.set_attribute("gen_ai.usage.completion_tokens", token_usage.get("completion_tokens", 0))

            # Close the telemetry span boundary
            span.set_status(Status(StatusCode.OK))
            span.end()

    def on_llm_error(self, error: BaseException, *, run_id: UUID, **kwargs: Any) -> None:
        """Captures framework runtime failures, mapping error text cleanly to Datadog."""
        span = self.active_spans.pop(str(run_id), None)
        if span:
            span.record_exception(error)
            span.set_status(Status(StatusCode.ERROR, description=str(error)))
            span.end()

    def on_tool_start(
        self, serialized: Dict[str, Any], input_str: str, *,
        run_id: UUID, parent_run_id: Optional[UUID] = None, **kwargs: Any
    ) -> None:
        """Tracks agentic tool sweeps, documenting external actions accurately."""
        span_name = f"langgraph.tool:{serialized.get('name', 'unnamed_tool')}"
        span = tracer.start_span(span_name)
        span.set_attribute("framework", "langgraph")
        span.set_attribute("tool.input", input_str)

        if parent_run_id:
            span.set_attribute("parent.run_id", str(parent_run_id))

        self.active_spans[str(run_id)] = span

    def on_tool_end(self, output: str, *, run_id: UUID, **kwargs: Any) -> None:
        """Closes the active tool trace span after successful execution."""
        span = self.active_spans.pop(str(run_id), None)
        if span:
            span.set_attribute("tool.output_length", len(output))
            span.set_status(Status(StatusCode.OK))
            span.end()
Executive Architectural Summary
Operating a resilient enterprise AI ecosystem requires deep visibility across your entire system. By implementing graph-based distributed tracing, adopting standardized OpenTelemetry schemas, deploying asynchronous telemetry pipelines, and enforcing privacy-preserving log filters, you can ensure your platform remains transparent, compliant, and easy to maintain at scale.