The Core Metric Scorecard - Quantifying Model Performance
Introduction
In traditional software engineering, performance monitoring is built on well-understood metrics: CPU utilization, memory consumption, network latency, and HTTP error rates. While these infrastructural metrics remain essential, they are completely inadequate for tracking the health of generative AI systems. An LLM application can exhibit perfect 200 OK responses, zero latency spikes, and low memory consumption while simultaneously serving toxic hallucinations or leaking corporate data to an end-user.
To safely operate probabilistic systems at enterprise scale, technology leaders must deploy a Core Metric Scorecard. This scorecard translates abstract, qualitative linguistic traits into concrete, quantitative, and trackable statistical metrics. By standardizing these evaluation data streams, engineering organizations can establish automated performance gates within continuous integration (CI) pipelines and detect subtle model regressions before they reach production.
1. The Enterprise Metric Taxonomy: Classifying AI Quality
An enterprise-grade metric scorecard must separate evaluation vectors into four distinct operational classifications. Trying to bundle these into a single "quality score" obscures actionable data, making it impossible for engineering teams to diagnose whether a regression is caused by an algorithmic failure, a system prompt change, or an underlying infrastructure bottleneck.
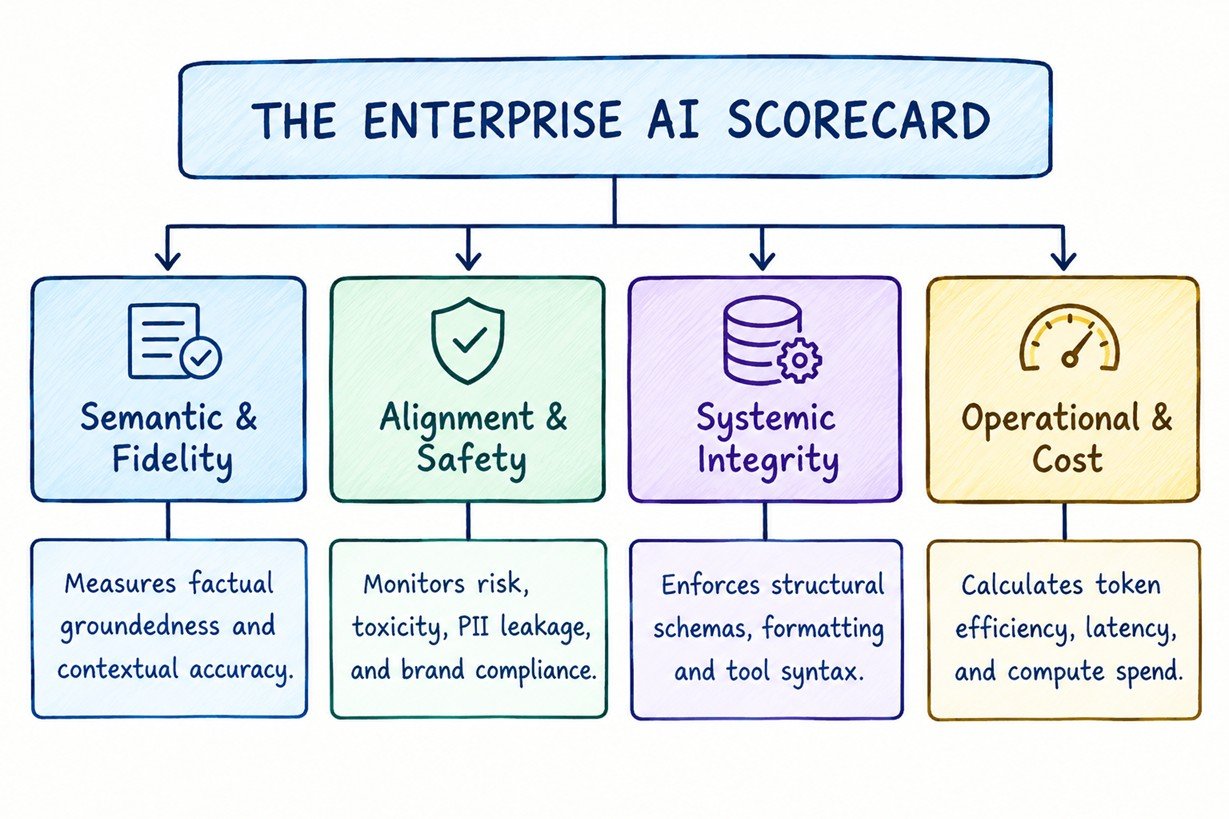
1. Semantic & Fidelity Metrics
- Groundedness (Faithfulness): The mathematical ratio of claims in the generated text that are explicitly supported by the reference context. Evaluated via Natural Language Inference (NLI) or LLM-as-a-Judge cross-checking to prevent hallucinations.
- Contextual Relevance: Measures how tightly the retrieved information matches the user's intent. Prevents the model from processing irrelevant noise.
- Semantic Similarity (BERTScore / Embedding Distance): Computes the cosine similarity between the vector embeddings of the generated response and a human-verified reference target, ensuring the core meaning remains accurate even if the exact vocabulary changes.
2. Alignment & Safety Metrics
- Toxicity and Harm Index: Programmatic classification scoring that checks for hate speech, bias, weaponization prompts, or inappropriate tone.
- PII Leakage Rate: Automated regex and named-entity recognition (NER) scanning to ensure the model does not output credit card numbers, social security identifiers, or protected client data.
- Jailbreak Resistance: Measures the system's ability to maintain its core instructions when challenged with adversarial prompt injections during automated stress testing.
3. Systemic Integrity Metrics
- Schema Compliance Rate: The percentage of outputs that perfectly match required technical schemas (e.g., valid JSON, strict Pydantic parsing, or exact Markdown headers).
- Tool Execution Accuracy: For agentic architectures, this measures the exact precision of tool selection and argument generation against an expected execution path.
- Fallback Trigger Frequency: Tracks how often the system relies on hardcoded safety fallbacks (e.g., "I am sorry, but I cannot assist with that"), indicating over-constrained prompting or system fragility.
4. Operational & Cost Metrics
- Time-to-First-Token (TTFT): Measures the millisecond latency before the model streams its first character, directly impacting perceived user experience.
- Tokens-per-Second (TPS) Throughput: Tracks model generation speed under varied concurrent user loads.
- Cost-per-Thousand-Tokens (Cost/1K): Calculates the financial efficiency of the architecture, exposing cost spikes caused by bloated prompt contexts or inefficient multi-turn histories.
2. Statistical Analysis & Regression Tracking: Catching the Subtle Drift
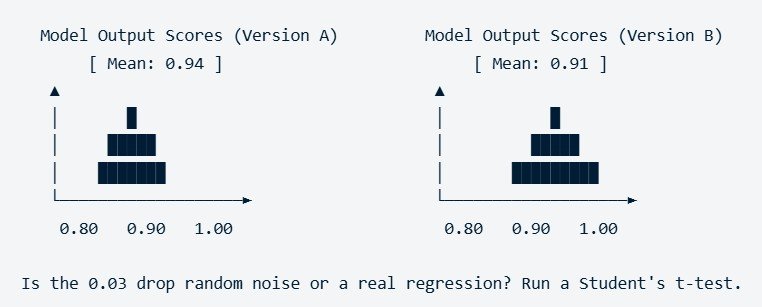
In deterministic systems, software changes produce clear binary outputs: a test passes or fails. In probabilistic systems, evaluating a code pull request (PR) against a golden dataset yields a distribution of scores. If your system's average groundedness score drops from 0.94 to 0.91, is that drop a normal statistical variation, or is it a systemic code regression caused by a prompt modification?
To answer this, technology leaders must introduce statistical process control (SPC) into their evaluation pipelines, shifting from single-point assertions to distribution analysis.
Implementing the T-Test for Pull Request Approvals
When evaluating a new model version or an updated system prompt, the testing framework should run a two-sample Student's t-test comparing the score distributions of the baseline system against the new candidate system.
- Set the Significance Threshold (p-value): Establish a strict corporate threshold (typically α = 0.05).
- Analyze the Variance: If the t-test yields a p-value less than 0.05, it indicates that the drop in performance is statistically significant and unlikely to be attributable to random chance. The CI pipeline must automatically halt the PR deployment, alerting engineers to the regression.
Establishing Z-Score Baselines for Continuous Monitoring
For production tracking, systems should calculate a rolling Z-score for core metrics like latency and groundedness over a moving 24-hour window:

Where X is the current batch score, μ is the historical rolling mean, and σ is the historical standard deviation. If the real-time production Z-score crosses ±3 (indicating a shift outside 99.7% of normal variations), the system flags an immediate alert for structural model drift or vector database corruption.
3. The Dashboard Strategy: Translating AI Math for the Executive Suite
Data dashboards fail when they try to serve everyone with the same view. A DevOps engineer debugging an API timeout requires radically different granularity than a Chief Risk Officer assessing regulatory exposure. Enterprises must split their scorecard presentation into two targeted reporting views:
The Engineering & Architecture Cockpit (High Granularity)
- Primary Users: AI Engineers, Data Scientists, DevOps teams.
- Key Visualization Anchors:
- Component-level scatterplots tracking Token Latency vs. Groundedness.
- Confusion matrices illustrating tool selection failures across agents.
- Token consumption heatmaps by microservice to isolate architectural inefficiencies.
- Actionable Outcome: Allows rapid root-cause isolation during development cycles.
The Executive Risk & Value Scorecard (High Synthesis)
- Primary Users: CTOs, VPs of Engineering, Chief Risk Officers, Business Unit Leads.
- Key Visualization Anchors:
- The Enterprise Safety Index: A single, rolling compliance metric tracking toxicity, data leakage, and alignment violations across all live production models.
- Value-to-Cost Efficiency Ratios: A financial chart plotting total token spend against successful business completions (e.g., cost per successfully resolved customer support ticket).
- Systemic Accuracy Trajectories: High-level trend lines showing system performance changes across major quarterly releases.
- Actionable Outcome: Provides executive leadership with the clear, data-driven visibility needed to make strategic capital, architectural, and governance decisions safely.